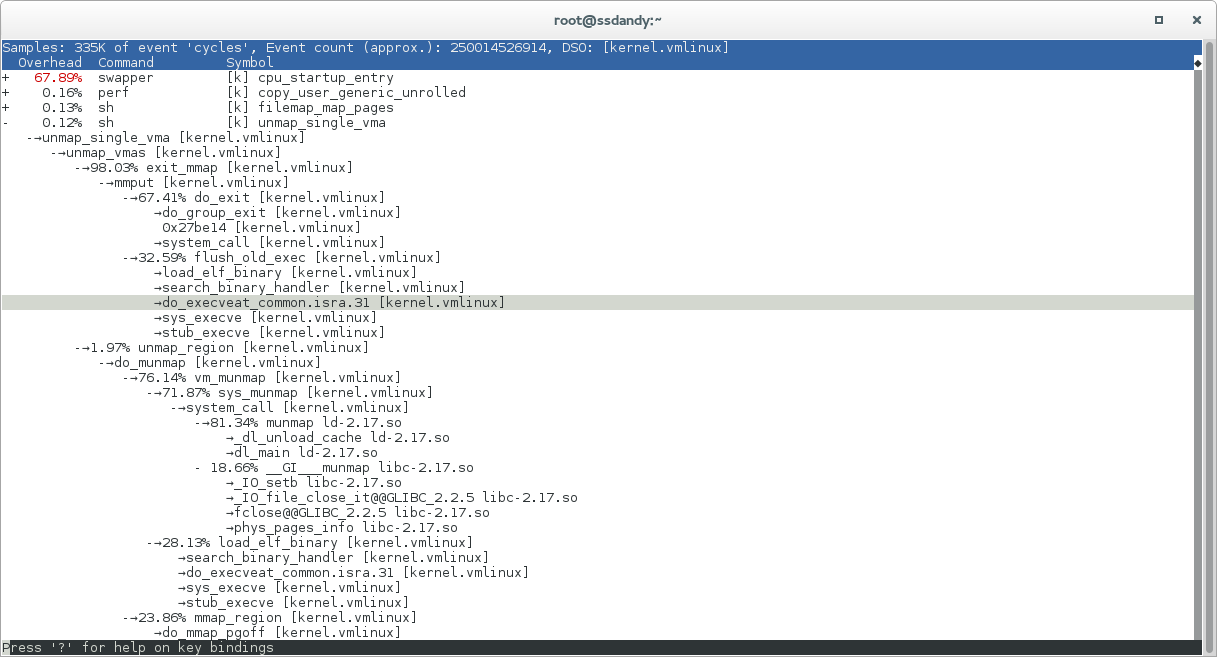
On Fri, Mar 20, 2015 at 2:07 PM, Arnaldo Carvalho de Melo
<[email protected]> wrote:
> Em Fri, Mar 20, 2015 at 05:39:22PM -0300, Arnaldo Carvalho de Melo escreveu:
>> Em Fri, Mar 20, 2015 at 10:15:53AM -0700, Stephane Eranian escreveu:
>> > On Thu, Mar 19, 2015 at 5:39 PM, Arnaldo Carvalho de Melo
>> > <[email protected]> wrote:
>> > > On Mar 19, 2015 9:34 PM, "Stephane Eranian" <[email protected]> wrote:
>> > >> On Thu, Mar 19, 2015 at 3:58 PM, Arnaldo Carvalho de Melo
>> > >> <[email protected]> wrote:
>> > >> >         This patch, together with what is in my perf/core branch,
>> > >> > should
>> > >> > implement that feature we talked about recently, i.e. to allow
>> > >> > annotating entries in callchains, please take a look at see if you
>> > >> > think
>> > >> > it is ok,
>
>> > >> I tried on tip.git and a simple example. It does what I wanted.
>> > >> I will try on more complex test cases.
>> > >> Thanks for implementing this quickly.
>
>> > > Thanks for testing, please let us know if you have further suggestions,
>
>> > Ok, it does not work.
>
> Are you sure? I just tried, take a look at:
>
> http://vger.kernel.org/~acme/perf-report-annotate-callchain-entries-in-multiple-DSOs-in-the-same-hist_entry.png
>
> In there you will see that in the unmap_single_vma case there are
> callchains that pass thru multiple DSOs in userspace (I used --call
> dwarf in 'perf record') and those are marked as having
> samples/annotation and when I go to those, pressing 'a' after moving the
> cursor to it and it works as expected...
>
> Do you have some specific example I could try?
>
I tried on an example I cannot share.
But I am guessing you could reproduce with a test which calls a libc
or libm function
heavily form multiple callers in the main program.
Example:
       -  pow()
           50% foo() [main.c]
           50% bar() [main.c]
If I move the cursor line to foo() and annotate foo() is shows me the
code of pow().

>> > I think it works as long as the caller you want to annotate is in the
>> > same module.
>> > But suppose, I am on malloc() (libc) and I want to see a caller of
>> > malloc(), it will
>> > propose 'annotate bar()', but will still show me the code of libc:malloc.
>> >
>> > In my earlier test, everything worked because the callee and caller were
>> > in the
>> > same module.
>> >
>> > Could you fix this?
>>
>> I thought that was covered because it deals with a "map_symbol" struct,
>> where it finds both the symbol and the DSO where it came from, etc.
>>
>> Checking that now...
>>
>>
>> - Arnaldo
--
To unsubscribe from this list: send the line "unsubscribe linux-kernel" in
the body of a message to [email protected]
More majordomo info at  http://vger.kernel.org/majordomo-info.html
Please read the FAQ at  http://www.tux.org/lkml/