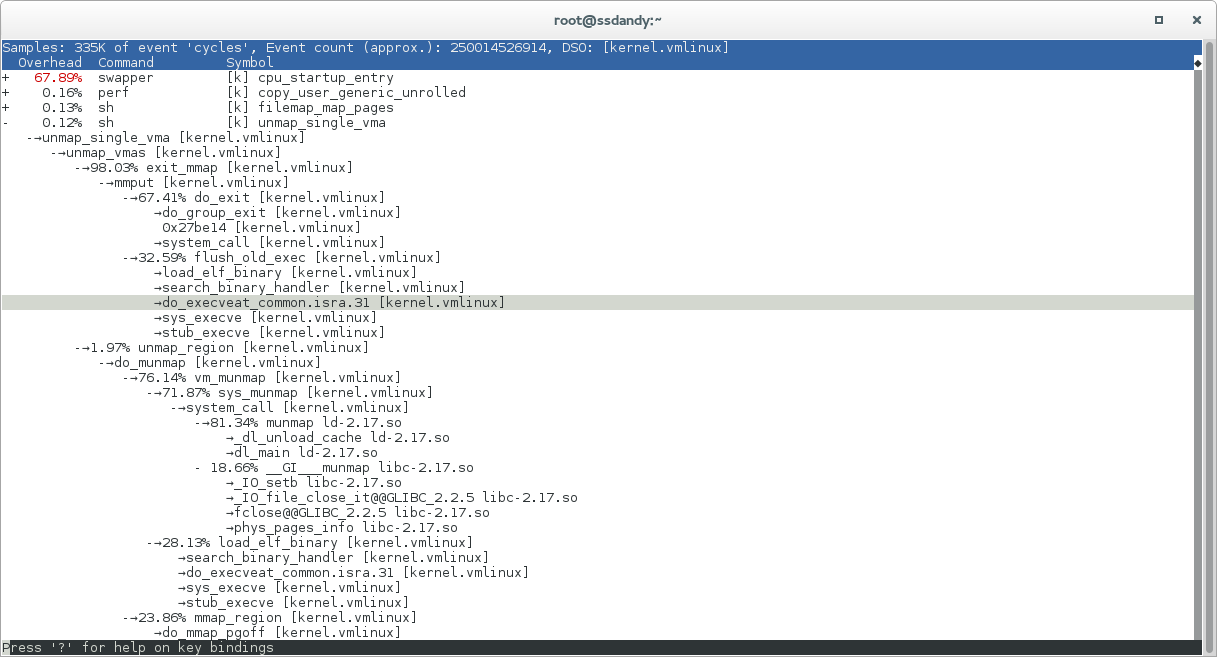
On Sun, Mar 22, 2015 at 5:27 PM, Namhyung Kim <[email protected]> wrote:
> Hi Stephane,
>
> On Fri, Mar 20, 2015 at 02:12:30PM -0700, Stephane Eranian wrote:
>> On Fri, Mar 20, 2015 at 2:07 PM, Arnaldo Carvalho de Melo
>> <[email protected]> wrote:
>> > Em Fri, Mar 20, 2015 at 05:39:22PM -0300, Arnaldo Carvalho de Melo
>> > escreveu:
>> >> Em Fri, Mar 20, 2015 at 10:15:53AM -0700, Stephane Eranian escreveu:
>> >> > On Thu, Mar 19, 2015 at 5:39 PM, Arnaldo Carvalho de Melo
>> >> > <[email protected]> wrote:
>> >> > > On Mar 19, 2015 9:34 PM, "Stephane Eranian" <[email protected]>
>> >> > > wrote:
>> >> > >> On Thu, Mar 19, 2015 at 3:58 PM, Arnaldo Carvalho de Melo
>> >> > >> <[email protected]> wrote:
>> >> > >> >         This patch, together with what is in my perf/core branch,
>> >> > >> > should
>> >> > >> > implement that feature we talked about recently, i.e. to allow
>> >> > >> > annotating entries in callchains, please take a look at see if you
>> >> > >> > think
>> >> > >> > it is ok,
>> >
>> >> > >> I tried on tip.git and a simple example. It does what I wanted.
>> >> > >> I will try on more complex test cases.
>> >> > >> Thanks for implementing this quickly.
>> >
>> >> > > Thanks for testing, please let us know if you have further
>> >> > > suggestions,
>> >
>> >> > Ok, it does not work.
>> >
>> > Are you sure? I just tried, take a look at:
>> >
>> > http://vger.kernel.org/~acme/perf-report-annotate-callchain-entries-in-multiple-DSOs-in-the-same-hist_entry.png
>> >
>> > In there you will see that in the unmap_single_vma case there are
>> > callchains that pass thru multiple DSOs in userspace (I used --call
>> > dwarf in 'perf record') and those are marked as having
>> > samples/annotation and when I go to those, pressing 'a' after moving the
>> > cursor to it and it works as expected...
>> >
>> > Do you have some specific example I could try?
>> >
>> I tried on an example I cannot share.
>> But I am guessing you could reproduce with a test which calls a libc
>> or libm function
>> heavily form multiple callers in the main program.
>> Example:
>>        -  pow()
>>            50% foo() [main.c]
>>            50% bar() [main.c]
>>
>> If I move the cursor line to foo() and annotate foo() is shows me the
>> code of pow().
>
> Did you play with acme/perf/core not tip/perf/core?  I got same
> problem but then I realize it's not the Arnaldo's tree.  When I
> changed to acme/perf/core the problem disappeared. :)
>
I was only trying it with tip.git. The patch looke simple enough to apply
to tip.git but clearly it relies on some other infrastructure changes which
I don't know about. In my case =, I care about getting this feature in tip.git
or older versions of perf.
> But unfortunately I got this segfault instead..
>
>   namhyung@sejong:perf$ perf report
>   perf: Segmentation fault
>   -------- backtrace --------
>   perf[0x506e5b]
>   /usr/lib/libc.so.6(+0x33540)[0x7fa3eb90a540]
>   perf[0x47b39c]
>   perf(disasm_line__free+0x58)[0x47c178]
>   perf(symbol__tui_annotate+0x2f3)[0x4fe683]
>   perf[0x503773]
>   perf(perf_evlist__tui_browse_hists+0x94)[0x505b44]
>   perf(cmd_report+0x18f0)[0x436890]
>   perf[0x47a793]
>   perf(main+0x60a)[0x427c7a]
>   /usr/lib/libc.so.6(__libc_start_main+0xf0)[0x7fa3eb8f7800]
>   perf(_start+0x29)[0x427d99]
>   [0x0]
>
>   namhyung@sejong:perf$ addr2line -e `which perf` 0x506e5b
>   /home/namhyung/project/linux/tools/perf/ui/tui/setup.c:106
>   namhyung@sejong:perf$ addr2line -e `which perf` 0x47b39c
>   /home/namhyung/project/linux/tools/perf/util/annotate.c:33
>
> Thanks,
> Namhyung
--
To unsubscribe from this list: send the line "unsubscribe linux-kernel" in
the body of a message to [email protected]
More majordomo info at  http://vger.kernel.org/majordomo-info.html
Please read the FAQ at  http://www.tux.org/lkml/