Hi James,
The datasets frac.80.mtz to frac.100.mtz are challenging to solve using SAD
phasing. However these datasets can be  easily solved using
other  experimental phasing method. Instead of using anomalous signal we could
use isomorphous signal only. For example RIP or SIR
phasing method, as there is a difference in intensity between the datasets due
to scattering of S and Se. Since frac.80.mtz data contains
20% selenium that is sufficient to solve the structure against the
frac.100.mtz. It seems the structure can be solved even as less as 10%
selenium content (frac.90.mtz vs frac.100.mtz), and substructure can be solved
easily. This is not surprising, the pair of the datasets is
quite isomorphous, . We phase all  reflections (centric and non-centric) where
as  anomalous phasing we could phase non-centric reflections
 only. In fact, Single Isomorphous Replacement phasing method is the first
phasing technique. This method has been further extended by
Ravelli et al with some deviation by introduction of X-ray or UV RIP phasing.
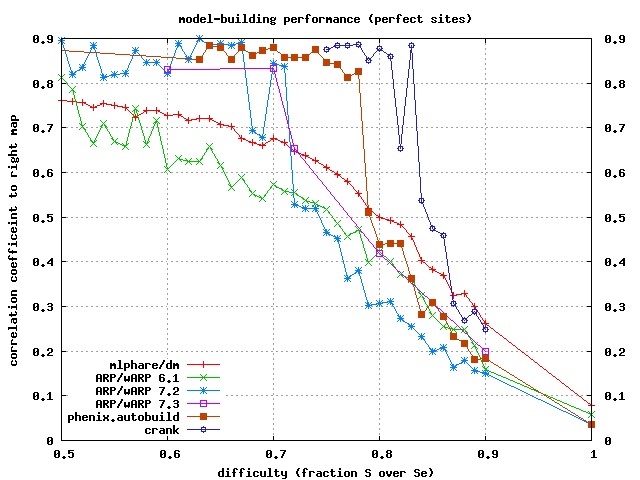
I  tried RIP (SIR)  phasing protocol of Auto-Rickshaw using frac.90.mtz  as
"before" and frac.100.mtz as "after". Auto-Rickshaw used
SHELXC/D/E and ARP/wARP/REFMAC5  to get the partially refined model (Rfree
below 30%) .

Cheers
Santosh

Santosh Panjikar, Ph.D.
Scientist
Australian Synchrotron
800 Blackburn Road
Clayton VIC 3168
Australia
Ph: +61-4-67770851
________________________________________
From: CCP4 bulletin board [[email protected]] On Behalf Of James Holton
[[email protected]]
Sent: Monday, January 14, 2013 8:12 PM
To: [email protected]
Subject: Re: [ccp4bb] a challenge

I am absolutely delighted at the response I have gotten to my little
"John Henry Challenge"!  Three people already have managed to do the
"impossible".  Congratulations to George Sheldrick, Pavol Skubak and Raj
Pannu for finding ways to improve the phases over the ones I originally
obtained (using the default settings of mlphare and dm) and build their
way out of it.  This is quite useful information!  At least it is to me.

Nevertheless, I do think Frances Reyes has a point.  This was meant to
be a map interpretation challenge, and not a SAD-phasing challenge.  I
appreciate that the two are linked, but the reason I did not initially
provide the anomalous data is because I thought it would be too much to
ask people to re-do all the phasing, etc. Yes, there do appear to be
ways to improve the maps beyond the particular way I phased them, but no
matter how good your phasing program is, there will always be a level of
anomalous signal that will lead to phases that are "off" enough to make
building the model "impossible".  Basically, once the map gets bad
enough that just as many "wrong" atoms get built in as "right" atoms,
then there is no escape.  However, I think human beings should still
have an advantage when it comes to pattern recognition, and I remain
curious to see if an insightful crystallographer can tip that balance in
the right direction.  I am also still curious to see if tweaking some
setting on some automated building program will do that too.  So, my
original question remains: are automated building programs better than
humans?  Any human?

I therefore declare the John Henry Challenge still open.


But yes, improving the phases can tip the balance too, and the accuracy
of the anomalous differences will ultimately affect the accuracy of the
phases, and so on.  This is a much broader challenge.  And I think the
best way to frame it is with the question:
"How low can the anomalous signal be before any conceivable approach fails?"
and perhaps:
"What is the best procedure to use for weak anomalous signal?"

  For those who are interested in joining George, Pavol, Raj and others
in this new challenge, the full spectrum of "difficulty" from trivial
(100% Se incorporation) to a complete waste of time (0% Se, 100% S) is here:
http://bl831.als.lbl.gov/~jamesh/challenge/occ_scan/

The "impossible.mtz" for the John Henry Map Interpretation Challenge was
derived from "frac0.79.mtz" and "possible.mtz" from "frac0.78.mtz".
These simulated 31% and 32% Se incorporation into Met side chains
(respectively).  It has now been shown that both of these can be solved
automatically if you do the phasing right. But what about frac0.80.mtz?
Or frac0.90.mtz ?  At least on this one "coordinate" of Se
incorporation, the prowess of a particular approach can be given a
"score".  For example, a "score" of 0.78 means that the indicated
procedure could solve the frac0.78.mtz dataset, but not the frac0.79.mtz
dataset.

Based on the reports I have gotten back so far, the "difficulty score"
lineup is:

score  method
0.86   xds, xscale, right sites, crank2 (Pavol Skubak)
0.78   xds, xscale, right sites, mlphare, dm, phenix.autobuild using 20
models (James Holton)
0.75   xds, xscale, right sites, mlphare, dm, buccaneer/refmac/dm (James
Holton)
0.71   xds, xscale, right sites, mlphare, dm, ARP/wARP 7.3 (James Holton)
0.51   xds, xscale, right sites, mlphare, dm, ARP/wARP 6.1.1 (James Holton)

Note that all of these attempts "cheated" on the sites.  Finding the
sites seems to be harder than solving the structure once you've got
them.  That lineup is:

score  method
0.82   cheating: xds, xscale, right phases, anomalous difference Fourier
(James Holton)
0.79   xds, xscale, shelxc/d/e 3.5A NTRY=10000 (George Sheldrick)
0.74   xds, autorickshaw (Santosh Panjikar)
0.65    xds, xscale, phenix.hyss --search=full (James Holton)
0.60   xds, xscale, shelxc/d with NTRY=100 (James Holton)

Where again the "score" is the dataset where the heavy atom site
constellation found is close enough to the "right" one to move forward.
This transition, like the model-building one, is remarkably sharp,
particularly if you let each step run for a lot of cycles.  The graph
for model-building is here:
http://bl831.als.lbl.gov/~jamesh/challenge/build_CC_vs_frac.png
Note how the final map quality is pretty much independent of the initial
map quality, up to the point where it all goes wrong.  I think this
again is an example of the solution needing to be at least "half right"
before it can be improved.  But perhaps someone can prove me wrong on
that one?

For those who want the unmerged data, I have all the XDS_ASCII.HKL files
here:
http://bl831.als.lbl.gov/~jamesh/challenge/occ_scan/XDS_ASCII.tgz

If you'd like to go all the way back to the images, you can get them
from here:
http://bl831.als.lbl.gov/~jamesh/workshop2/
the "badsignal" dataset is what produced frac1.00.mtz, and "goodsignal"
produced frac0.00.mtz.  You can generate anything in between using the
provided img_mix.com script.


Oh, and when it comes to how useful it is to spend "weeks" building
manually into a bad map, well I suppose that does indeed depend on what
alternatives you have and on the science you are trying to do.  I agree
that it is always better to have better data, but if you spend too much
time trying to improve your crystals and waiting for your next beam
time, then somebody else who IS willing to build into dodgy maps will
probably do the science for you and publish it first.  So, I think in a
world of competitive grant renewals it really is critically important to
know at what point it actually is "impossible" to solve the structure,
as opposed to a situation where trying some new procedure (or
collaborator) might be the way to go.  I'd like to be able to answer
that question for my users, and that's why I'm doing this.

-James Holton
MAD Scientist


On 1/13/2013 12:11 PM, jens Preben Morth wrote:
> I agree with Tassos, and btw think that this crystallographer, should
> be able to go back into the lab and optimize the present crystal
> conditions to get better crystals. In particularly, when he or she
> realize that the scientific question they set out to investigate
> cannot be answered, by analyzing the final structure, with the
> available data quality.
> Preben
>
>
> On 1/13/13 8:52 PM, Anastassis Perrakis wrote:
>>> I think the real challenge (and one that makes for an excellent
>>> macromolecular crystallographer) is how well one can interpret a map
>>> with poor phases.
>> Let me disagree ... An excellent macromolecular crystallographer, is
>> one that given some crystals can derive the best strategy to collect
>> data,
>> process the data optimally, derive phases using all available
>> information, build a model and refine it in such a way that it best
>> explains both data
>> and geometrical expectations, and do these as efficiently as possible.
>>
>> Efficiency may suggest using one automated suite or another - or
>> indeed may best be achieved by manual labor - be it in the map or in
>> data
>> collection strategy or refinement or another step: and here I am
>> ignoring the art of transforming
>> hair-needle-crystalline-like-dingbits to a diffracting crystal.
>>
>> One that can interpret a map with poor phases can be either a genius
>> in 3d orientation - or a not necessarily too intelligent nor
>> experienced but determined student
>> that can drink and breathe this map for a few weeks in a row until a
>> solution is in place. Neither would make an excellent macromolecular
>> crystallographer by necessity.
>>
>> Tassos