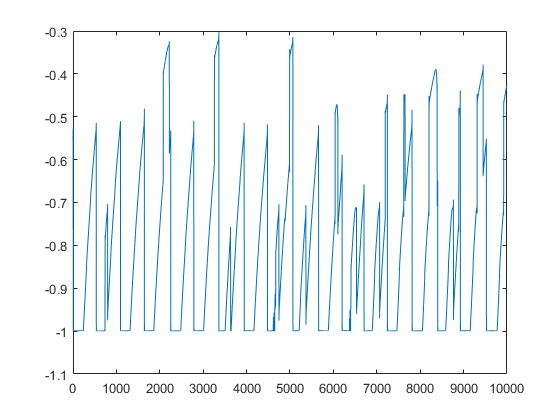
Hi,I transmitted 0.3 + 0.3i signals on the 900e6 frequency(i.e. sudo
./tx_waveforms --rate 1e6 --freq 900e6 --ref "external" --gain 85)and then I
received the signal(i.e. sudo ./rx_samples_to_file --type "float" --rate 1e6
--freq 900e6 --gain 40 --nsamps 10000)and then I extracted the real and
imaginary parts using MATLAB and plotted it.I expected a constant line(i.e.
0.3*gain on real, 0.3*gain on imag) on both real and imaginary figures since I
transmitted a constant real and imaginary signal, but the figures were beyond
my expectation. I attached the figures.Q1. Is it normal behavior?Q2. If it
does, what's the source of this fluctuation?Here are my experimental
setup.-Experimental setup:USRP B200 TX/RX <---> 30dB attenuator <----cable---->
USRP B200 RX2Ref port on both USRP b200 are connected to the Octoclock-G. The
octoclock-G use external antenna.the UHD version is
"UHD_3.11.0.1-16-g34fc6362"Regards,Hojoon
![]() real.png
real.png
Description: Binary data
imag.png
Description: Binary data_______________________________________________ USRP-users mailing list USRP-users@lists.ettus.com http://lists.ettus.com/mailman/listinfo/usrp-users_lists.ettus.com