On 8/10/22 1:50 AM, Fons Adriaensen wrote:
On Tue, Aug 09, 2022 at 12:30:25PM -0700, Fernando Lopez-Lezcano wrote:
Any graphs of the performance in elevation != 0? Ie: plots, of, say, "T" at
different frequencies? I'm really curious...
For the EM and the Zylia I used two sets of 'measurements':
- A set of 324 directions distributed 'uniformly' in 3D, used
to compute the A/B matrix.
- A set of 180 directions in the horizontal plane, used to
plot the polar patterns in the report.
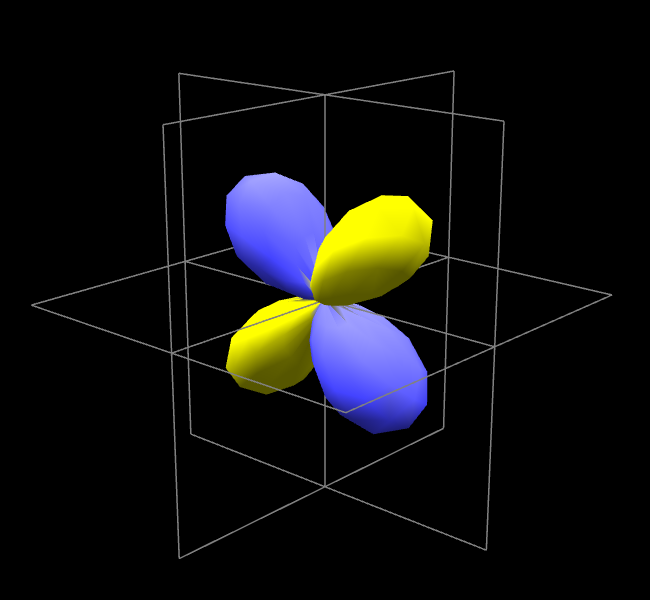
I can make 3D plots of the patterns using the first set, see e.g.
<http://kokkinizita.linuxaudio.org/ambisonics/zylia-acn7-1k.png>
but with only 324 points they look rather rough. [1]
Thank, I should have been more explicit, I was more interested in the
actual measured performance of both the calibrated octomic and voyage in
the z axis (vs frequency, of course)...
Best,
-- Fernando
But it would just be a matter of using a larger grid with a few
thousands points to fix that.

Anyway the results just confirm what is shown by the horizontal
patterns.
Any information on how the measurements were taken?
For the SpatialMic the same set of measurements and numerical
procedure was used as is done for every Octomic. This uses less
than 324 measurements of course, but is still very much
overdetermined. As I'm bound by an NDA I can't go into the
details.


[1] One could question using the same set to compute the A/B
matrix and then to plot the result. But with 324 measurements
the matrix inversion is overdetermined by a very large factor
anyway, so this is still valid.
_______________________________________________
Sursound mailing list
Sursound@music.vt.edu
https://mail.music.vt.edu/mailman/listinfo/sursound - unsubscribe here, edit
account or options, view archives and so on.