You probably want either the ipcp function from the iplots package or the
rggobi package (along with the ggobi program).  Neither uses lattice, iplots
uses java and rggobi passes your data to the ggobi program which does a lot
with brushing/spinning/etc.
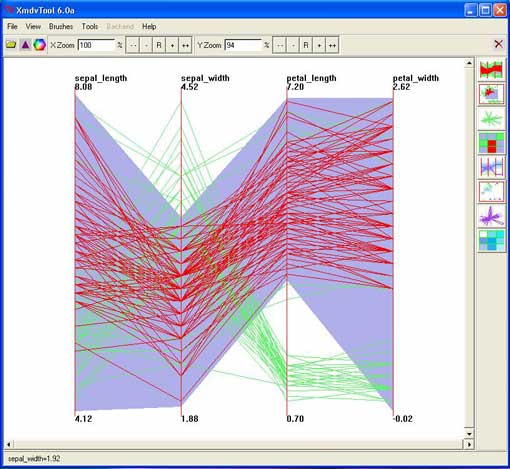
For general brushing there is also the tkBrush function in the TeachingDemos
package (but it only does scatterplot matricies) or the tkexamp function in the
same package that makes creating custom dynamic plots easier (use a tk control
to change arguments which could include a threshold for changing color).

Hope this helps,

________________________________________
From: [EMAIL PROTECTED] [EMAIL PROTECTED] On Behalf Of June Kim [EMAIL
PROTECTED]
Sent: Saturday, September 13, 2008 1:37 AM
To: r-help@r-project.org
Subject: [R] brushing with parallel coordinates

Hello,

I have a multivariate data with a single Y variable and 9 X variables.
I tried drawing a parallel coordinates with the data set without a
problem, using lattice library. However, I want to do some brushing on
the graph. For example, I want to distinguish the group of data lines
of which Y values are bigger than 0.5. It could be through
coloring(red line, maybe).

Have a look at the brushing facility provided with another tool:

http://www.rebeccashapley.com/assignments/is247/images/xmdvbrush_.jpg

Can I do the job easily with lattice? Or should I change the tool?

______________________________________________
R-help@r-project.org mailing list
https://stat.ethz.ch/mailman/listinfo/r-help
PLEASE do read the posting guide http://www.R-project.org/posting-guide.html
and provide commented, minimal, self-contained, reproducible code.

______________________________________________
R-help@r-project.org mailing list
https://stat.ethz.ch/mailman/listinfo/r-help
PLEASE do read the posting guide http://www.R-project.org/posting-guide.html
and provide commented, minimal, self-contained, reproducible code.