Hello,

I have a multivariate data with a single Y variable and 9 X variables.
I tried drawing a parallel coordinates with the data set without a
problem, using lattice library. However, I want to do some brushing on
the graph. For example, I want to distinguish the group of data lines
of which Y values are bigger than 0.5. It could be through
coloring(red line, maybe).
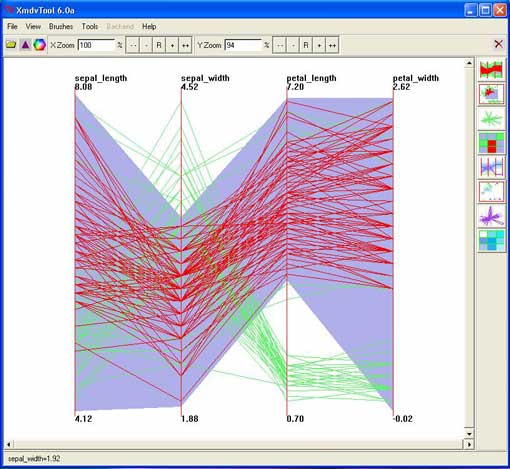
Have a look at the brushing facility provided with another tool:

http://www.rebeccashapley.com/assignments/is247/images/xmdvbrush_.jpg

Can I do the job easily with lattice? Or should I change the tool?

______________________________________________
R-help@r-project.org mailing list
https://stat.ethz.ch/mailman/listinfo/r-help
PLEASE do read the posting guide http://www.R-project.org/posting-guide.html
and provide commented, minimal, self-contained, reproducible code.