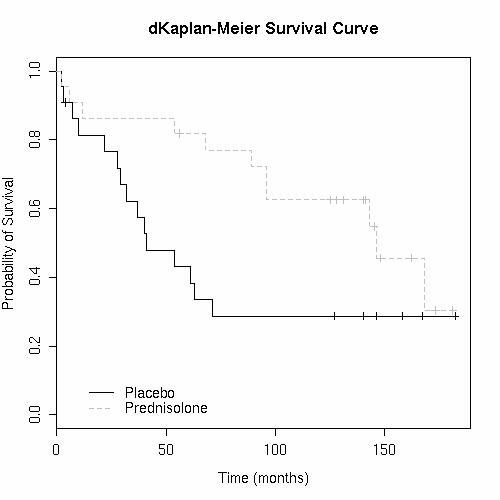
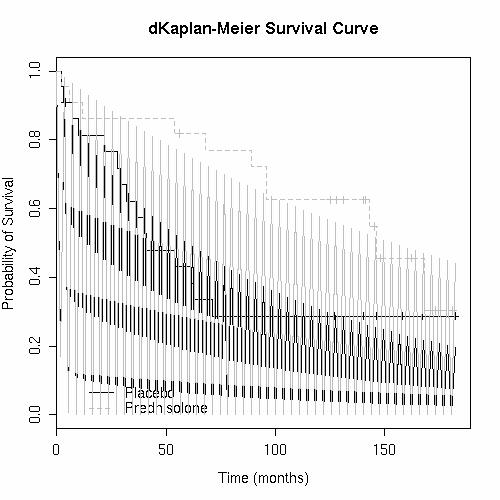
Calum wrote:
> OK this is bound to be something silly as I'm completely new to R -
> having started using it yesterday.  However I am already warming to its
> lack of 'proper' GUI... I like being able to rerun a command by editing
> one parameter easily... try and do that in a Excel Chart Wizzard!
>
> I eventually want to use it to analyse some chemotherapy response /
> survival data. That data will not be mature and so my interest is in
> using it to deliver predictions of what mature data may produce by using
> Weibull Regression
>
> However for now I've borrowed a dataset from the BMJ (CSV tabs seperated
> version here:
> http://www.wittongilbert.free-online.co.uk/HepatitisData.csv ) and am
> trying to plot some curves.
>
> I've succeeded in plotting a Kaplan-Meier Survival Curve by using the
> following:
>
>  > my_var.bygroup <- survfit(Surv (Survival, Censored==0) ~
> TreatmentGroup, data=TestData)
>  > plot(my_var.bygroup, conf.int=FALSE, col=c("black","grey"), lty=1:2,
> legend.text=c("Placebo","Prednisolone"), main="dKaplan-Meier Survival
> Curve",  xlab="Time (months)", ylab="Probability of Survival")
>
> That produces this: http://www.wittongilbert.free-online.co.uk/RGraph.jpg
>
> All of that  is very nice so far.  The  I followed bits and pieces of
> other peoples posts in the past to plot on a weibull regression...
>
>  > my_curve.Plac <- survreg( Surv(Survival, Censored==0)~
> TreatmentGroup, subset=TreatmentGroup=="Placebo", data=TestData,
> dist='weibull')
>  > curve(pweibull(x, scale=exp(coef(my_curve.Plac)),
> shape=1/my_curve.Plac$scale, lower.tail=FALSE),from=0, col="black",
> to=max(TestData$Survival), add=TRUE)
>  > my_curve.Pred <- survreg( Surv(Survival, Censored==0)~
> TreatmentGroup, subset=TreatmentGroup=="Prednisolone", data=TestData,
> dist='weibull')
>  > curve(pweibull(x, scale=exp(coef(my_curve.Pred)),
> shape=1/my_curve.Pred$scale, lower.tail=FALSE),from=0, col="grey",
> to=max(TestData$Survival), add=TRUE)
>
> This is where I have my problem - and I know its going to be something
> really silly!  Look at my output:
> http://www.wittongilbert.free-online.co.uk/RGraph2.jpg the trend line is
> zig-zagging between y=0 and the value it should be.  If you draw a line
> along the tips of the zig-zags I guess thats a reasonable trendline...
>
> Anyone able to help me on this?
>
I'd take a hard look at the pweibull(...)  bit. Is "scale" really what
you want it to be? If coef(my_curve.Pred) is not a scalar, then it gets
recycled, which could easily cause oscillations.
> Also is it possible to get an R-squared type value for the fit of this
> curve from someplace?
>
> Finally (three questions in one!) the first two censored data points (1
> in each group) are actually lost to follow-ups.  Should they be marked
> differently from censored?
>
Customarily they are not. (I'm sure it is possible to speculate at
length about it, though.)
> Sorry I know thats a mamoth post - and have a horrible feeling someone's
> going to say 'You are trying to do something thats statistically wrong!'
> - feel free!
>
Nothing spectacularly incompetent this far... (I'm not happy with R^2
measures outside of linear models, or even within linear models, but
several well-reputed people do find them useful, so who am I to bicker?)

--
   O__  ---- Peter Dalgaard             Øster Farimagsgade 5, Entr.B
  c/ /'_ --- Dept. of Biostatistics     PO Box 2099, 1014 Cph. K
 (*) \(*) -- University of Copenhagen   Denmark      Ph:  (+45) 35327918
~~~~~~~~~~ - ([EMAIL PROTECTED])              FAX: (+45) 35327907

______________________________________________
R-help@r-project.org mailing list
https://stat.ethz.ch/mailman/listinfo/r-help
PLEASE do read the posting guide http://www.R-project.org/posting-guide.html
and provide commented, minimal, self-contained, reproducible code.