On Tue, May 16, 2017 at 12:21 AM, Thomas Helland
<thomashellan...@gmail.com> wrote:
> 2017-05-15 21:08 GMT+00:00 Marek Olšák <mar...@gmail.com>:
>> On Mon, May 15, 2017 at 10:00 PM, Thomas Helland
>> <thomashellan...@gmail.com> wrote:
>>> Would this be a win for a game limited by the winsys/buffer handling?
>>> I played some Hitman the other day, and noticed my gpu-utilization
>>> was hovering at about 80%. Some profiling later and I concluded
>>> that one thread was pegged at 100% doing buffer handling work.
>>> amdgpu_cs_add_buffer, amdgpu_lookup_buffer, the cso_hash,
>>> and a couple other functions related to the winsys where the hottest.
>>> Should I expect that to be mitigated by your threaded_gallium work,
>>> or by this patch series? If so, I will not delve into that much further =)
>>
>> amdgpu_cs_add_buffer and amdgpu_lookup_buffer overhead will definitely
>> be hidden by threaded gallium. cso_hash will not.
>>
>> I don't think what you're seeing is related, but I'd be interested in
>> a screenshot of sysprof showing what you described.
>>
>> Marek
>
> The below dropbox link has two screenshots showing the situation.
> The data was collected by attaching perf to the process,
> and the report was made with "perf report --hierarchy".
> I can collect data with sysprof on Thursday, if you want.
> My cpu(FX8320) was hovering at about 50% load at the time,
> so with one of eight cores being pegged at 100% that matches
> pretty well up with the 24% we're seeing here.
> (25% * 50% = 12.5% = 1/8).
> As can be seen from the second screenshots the overhead
> is quite evently distributed, with no one function being the big offender.
> However, what I noticed was amdgpu_cs_add_buffer,
> si_set_constant_buffer and amdgpu_lookup_buffer.
> I might be completely of track though, so you should
> probably take this with the usual tablespoon of salt.
>
> https://www.dropbox.com/sh/r815zuklfwxy20q/AABrtKkb6Dc4pnW4u5Ul86-Ua?dl=0
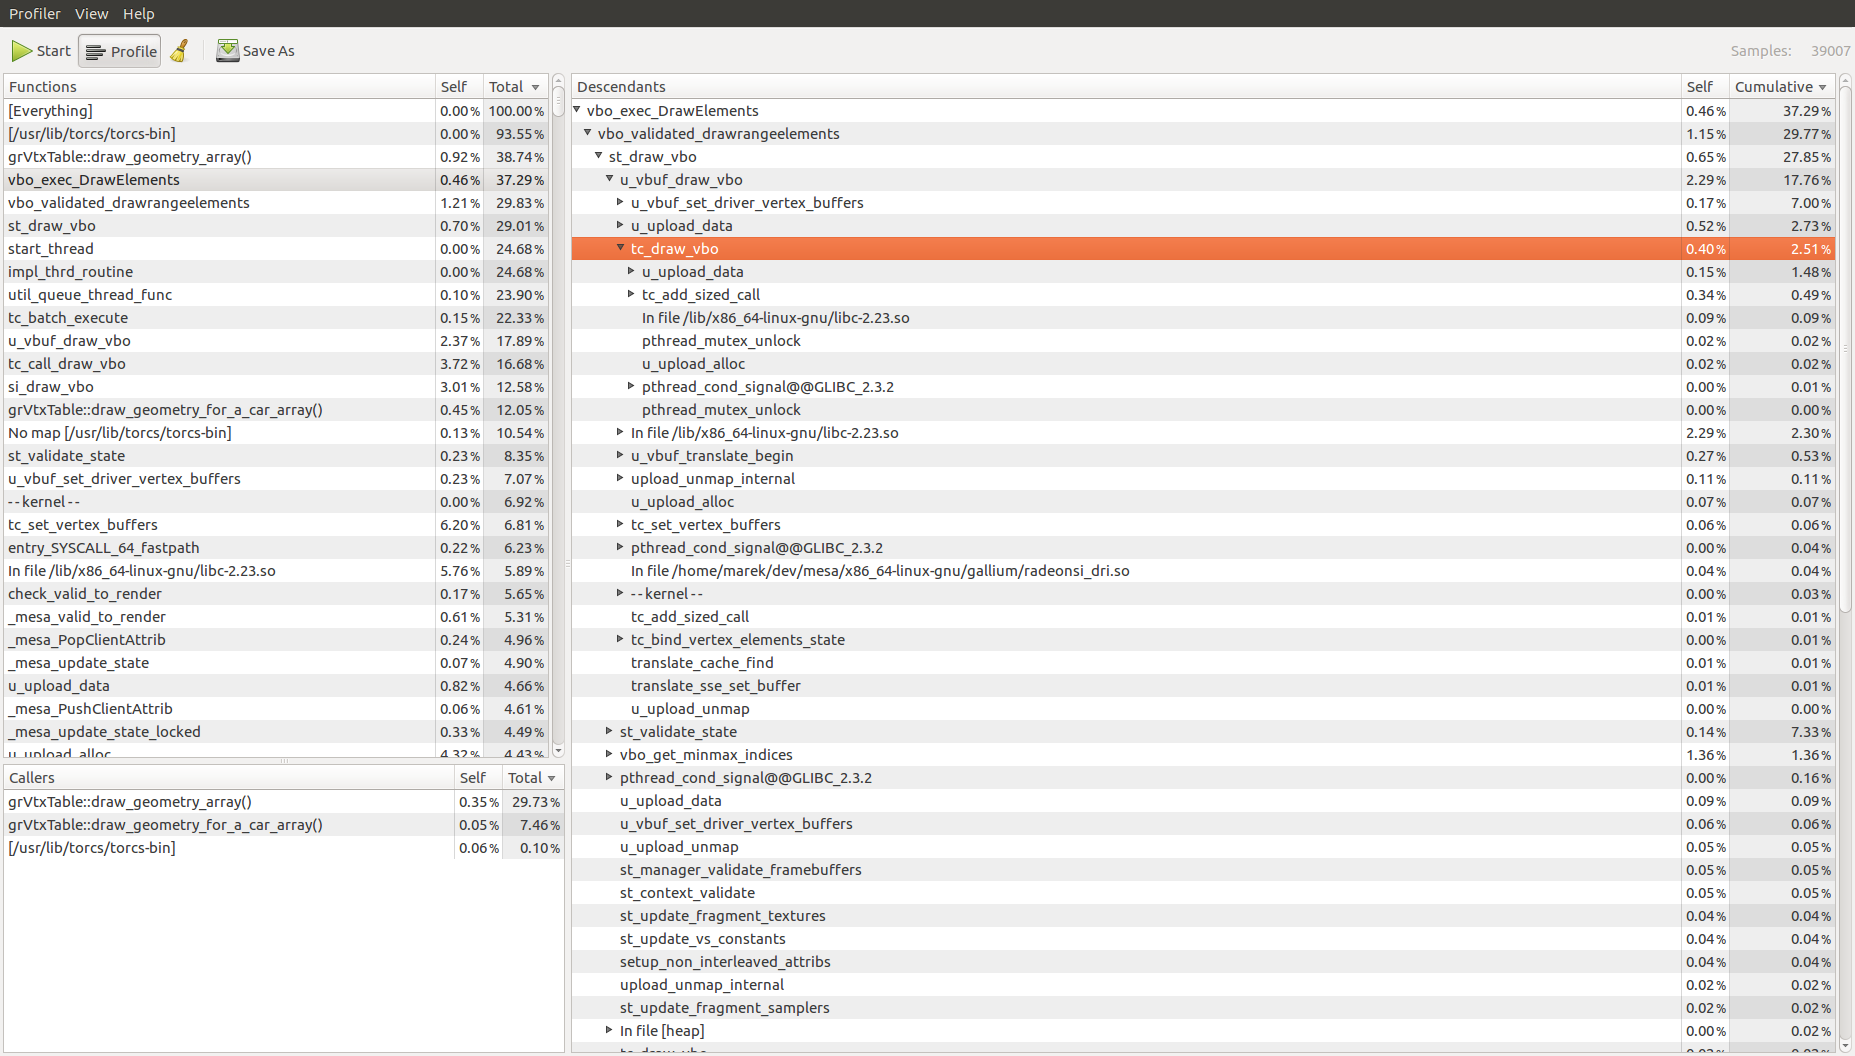
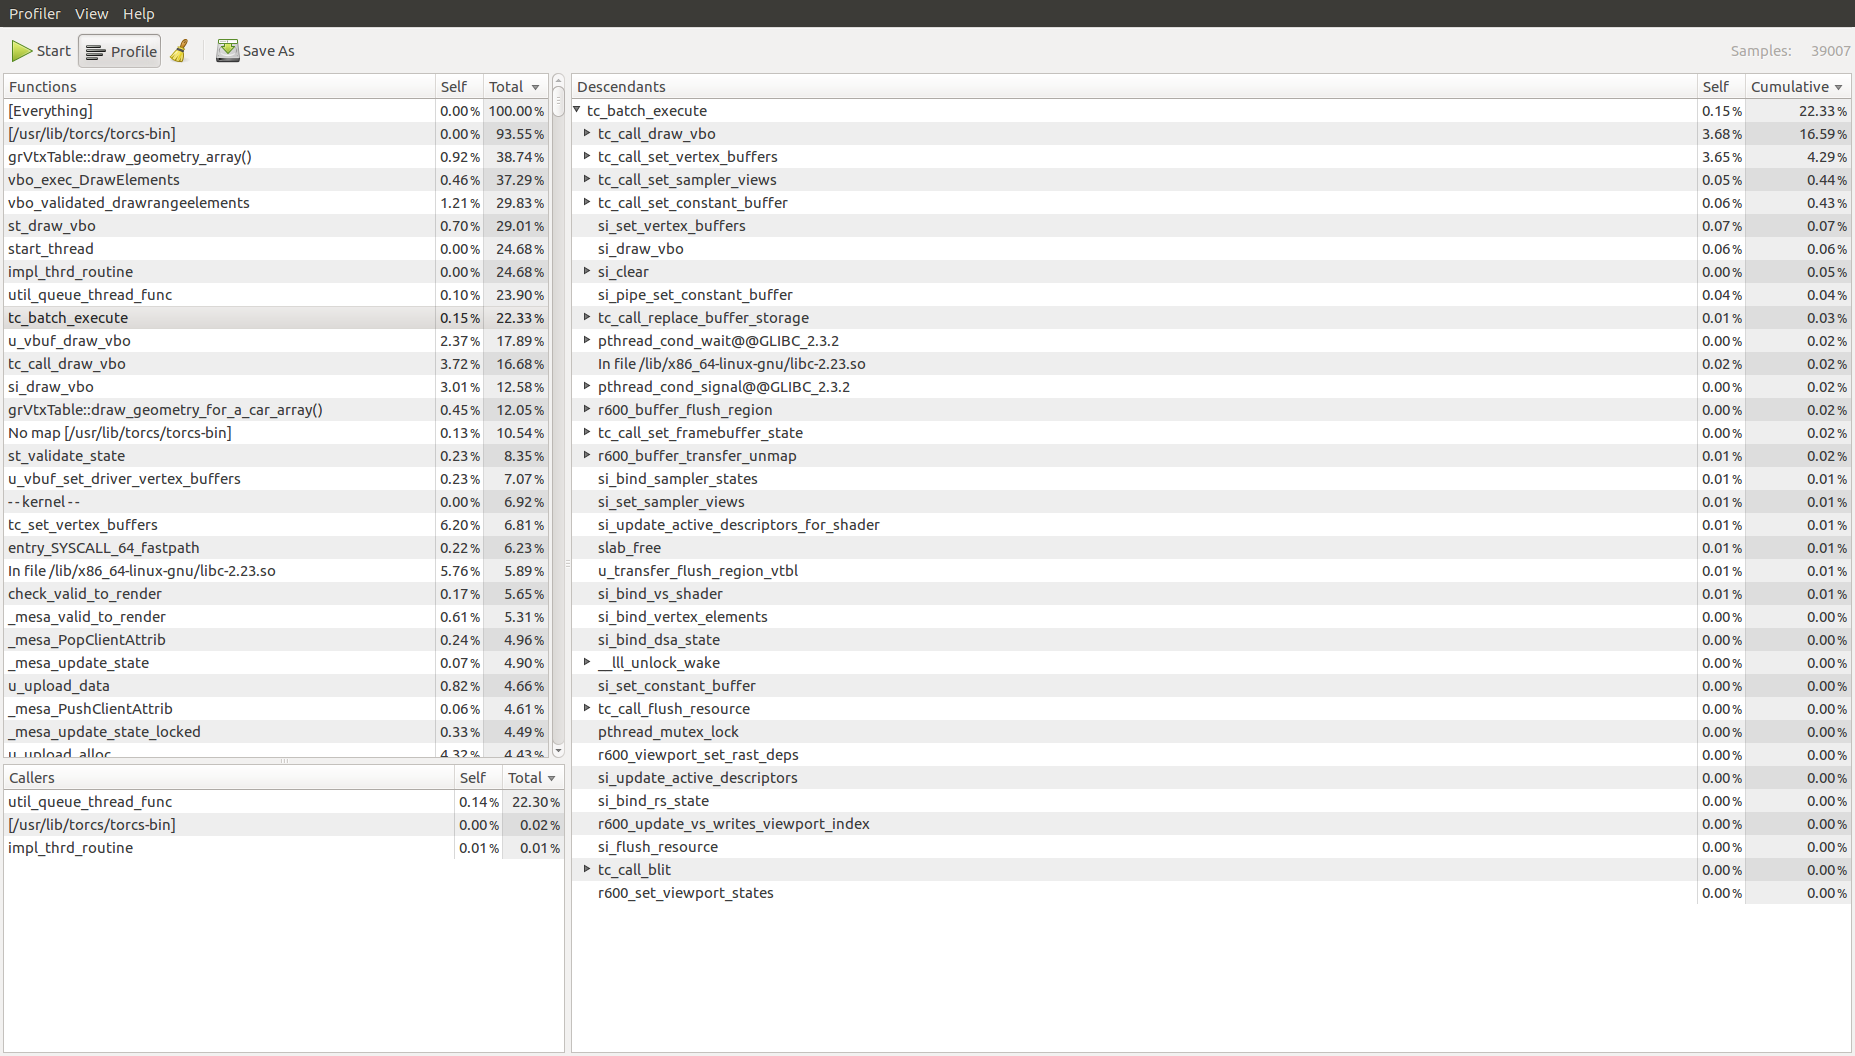
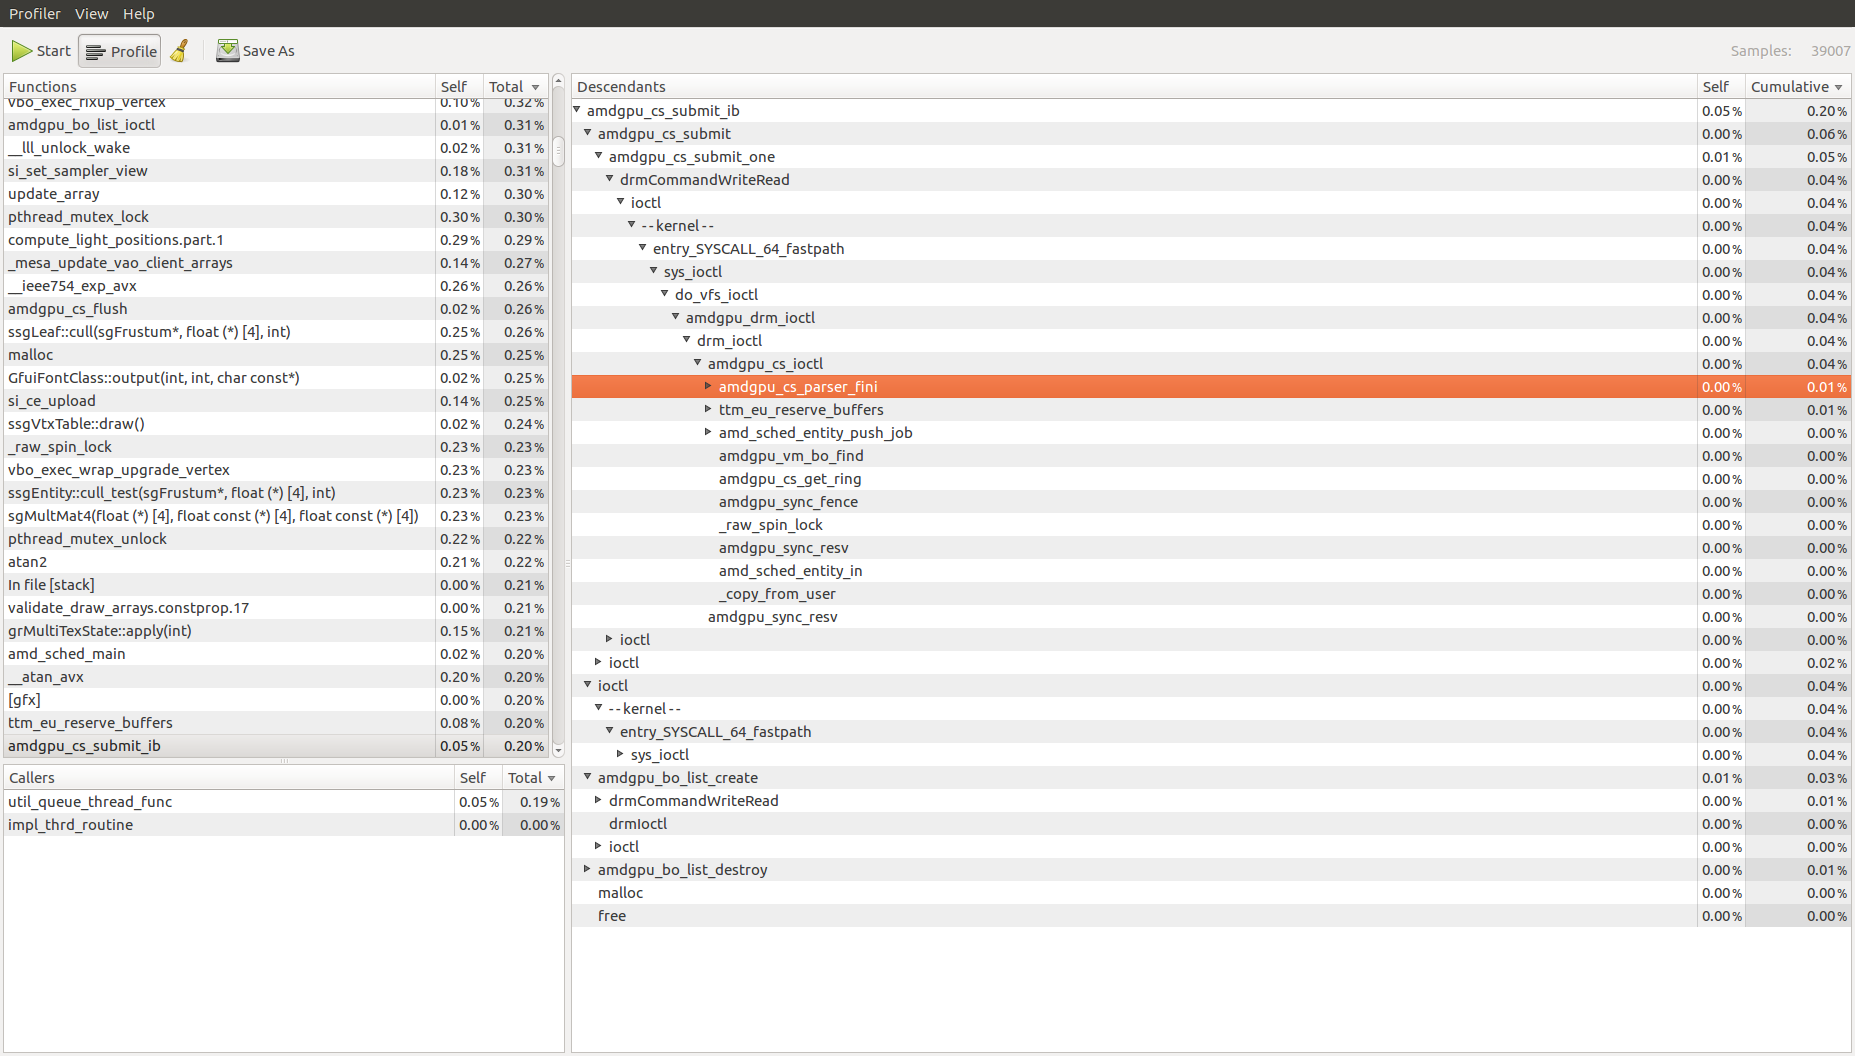
I think the problem is that you don't build Mesa with
-fno-omit-frame-pointer, so frame-pointer-based profiling doesn't show
the total time spent in functions and doesn't show call trees either.

To demonstrate what sysprof should look like, this is DrawElements
(main app thread):
https://people.freedesktop.org/~mareko/sysprof_DrawElements.png

This is the basic look at the gallium thread:
https://people.freedesktop.org/~mareko/sysprof_gallium_threaded.png

And this is the CS ioctl thread. Note that the call tree goes all the
way to the kernel driver:
https://people.freedesktop.org/~mareko/sysprof_cs_thread.png

Marek
_______________________________________________
mesa-dev mailing list
mesa-dev@lists.freedesktop.org
https://lists.freedesktop.org/mailman/listinfo/mesa-dev