liyafan82 commented on issue #8397: [FLINK-11421][Table SQL/Runtime]Add compilation options to allow comp… URL: https://github.com/apache/flink/pull/8397#issuecomment-492598238 Hi @KurtYoung @JingsongLi , I have evaluated some benchmarks, and the results are as follows. Please give your valuable feedback. To evaluate the effects of the compilation options, we use TPC-H Q1 as the benchmark, because it is a relatively simple query, which makes it easier for demonstration. The evaluations are based on our vectorized code, because it is more notable on the vectorized code. The execution plan of Q1 is as follows: 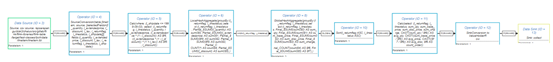 It can be seen that the following operators are based on code-gen: SourceConversion (ID = 4), Calc (ID = 5), LongHashAggregate (ID = 6), GlobalHashAggregate (ID = 8), Calc (ID = 11), SinkConversion (ID = 12). However, we exclude some operators from our analysis: 1) Operators SourceConversion (ID = 4) and SinkConversion (ID = 12) are excluded, because their code is quite simple. 2) Operators GlobalHashAggregate (ID = 8), Calc (ID = 11) are excluded, because their input is too small (only 4 records), and processing them takes very short time (< 1ms) Therefore, we only consider Calc (ID = 5), LongHashAggregate (ID = 6) in our analysis. The table below shows the average time (in ms) for each operator for processing Q1 (1TB) in our cluster: Operator\Compiler | JCA | Janino -- | -- | -- Calc (ID = 5) | 3858.07 | 7146.9 LongHashAggregate (ID = 6) | 2493.75 | 3923.17 It can be seen that the code compiled by JCA runs much faster. The following table shows the compilation time (in ms) with different compilers. Note that compilation times for other operators are also given for reference. Operator\Compiler | JCA | Janino -- | -- | -- SourceConversion (ID = 4) | 92 | 4 Calc (ID = 5) | 148 | 15 LongHashAggregate (ID = 6) | 854 | 44 GlobalHashAggregate (ID = 8) | 200 | 58 Calc (ID = 11) | 117 | 10 SinkConversion (ID = 12) | 99 | 4 It can be seem that the compilation time for JCA is one magnitude large than the compilation time for Janino. To hide such latency by two techniques: 1) By using a class cache, tasks in the same JVM can reuse the compilation results. 2) The time for compiling a batch is much smaller than the sum of compiling classes individually. The latter is not implemented in the current PR, because it involves changes to other parts of the code based. We will implement in another separate JIRA. To investigate why the code produced by JCA is better, we dumped all class files, and it can be easily seen that the file sizes are different: Operator\Compiler | JCA | Janino -- | -- | -- SourceConversion (ID = 4) | 2 KB | 2 KB Calc (ID = 5) | 6 KB | 5 KB LongHashAggregate (ID = 6) | 13 KB | 9 KB GlobalHashAggregate (ID = 8) | 18 KB | 12 KB Calc (ID = 11) | 7 KB | 5 KB SinkConversion (ID = 12) | 3 KB | 2 KB By analyzing the byte code, we found there are slight differences in the code structure. For example, the following figure shows the bytecode of the main processing method for Calc (ID = 5): 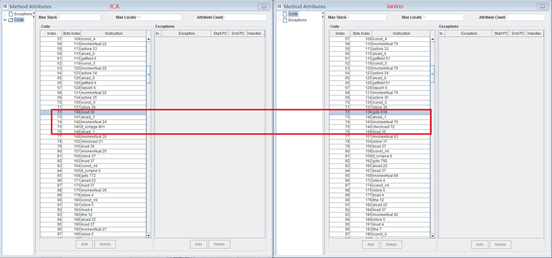
----------------------------------------------------------------
This is an automated message from the Apache Git Service.
To respond to the message, please log on to GitHub and use the
URL above to go to the specific comment.

For queries about this service, please contact Infrastructure at:
us...@infra.apache.org


With regards,
Apache Git Services