On Tue, Jul 18, 2006 at 07:51:52AM -0300, User Freebsd wrote:
>
> 'k, had a bunch of fun tonight, but one of the results is that I was able
> to achieve file system deadlock, or so it appears ...
>
> Using the following from DDB:
>
> set $lines=0
> show pcpu
> show allpcpu
> ps
> trace
> alltrace
> show locks
> show alllocks
> show uma
> show malloc
> show lockedvnods
> call doadump
>
> I've been able to produce the attached output, as well as have a core dump
> that can hopefully be used to gather any that I may have missed this time
> *cross fingers*
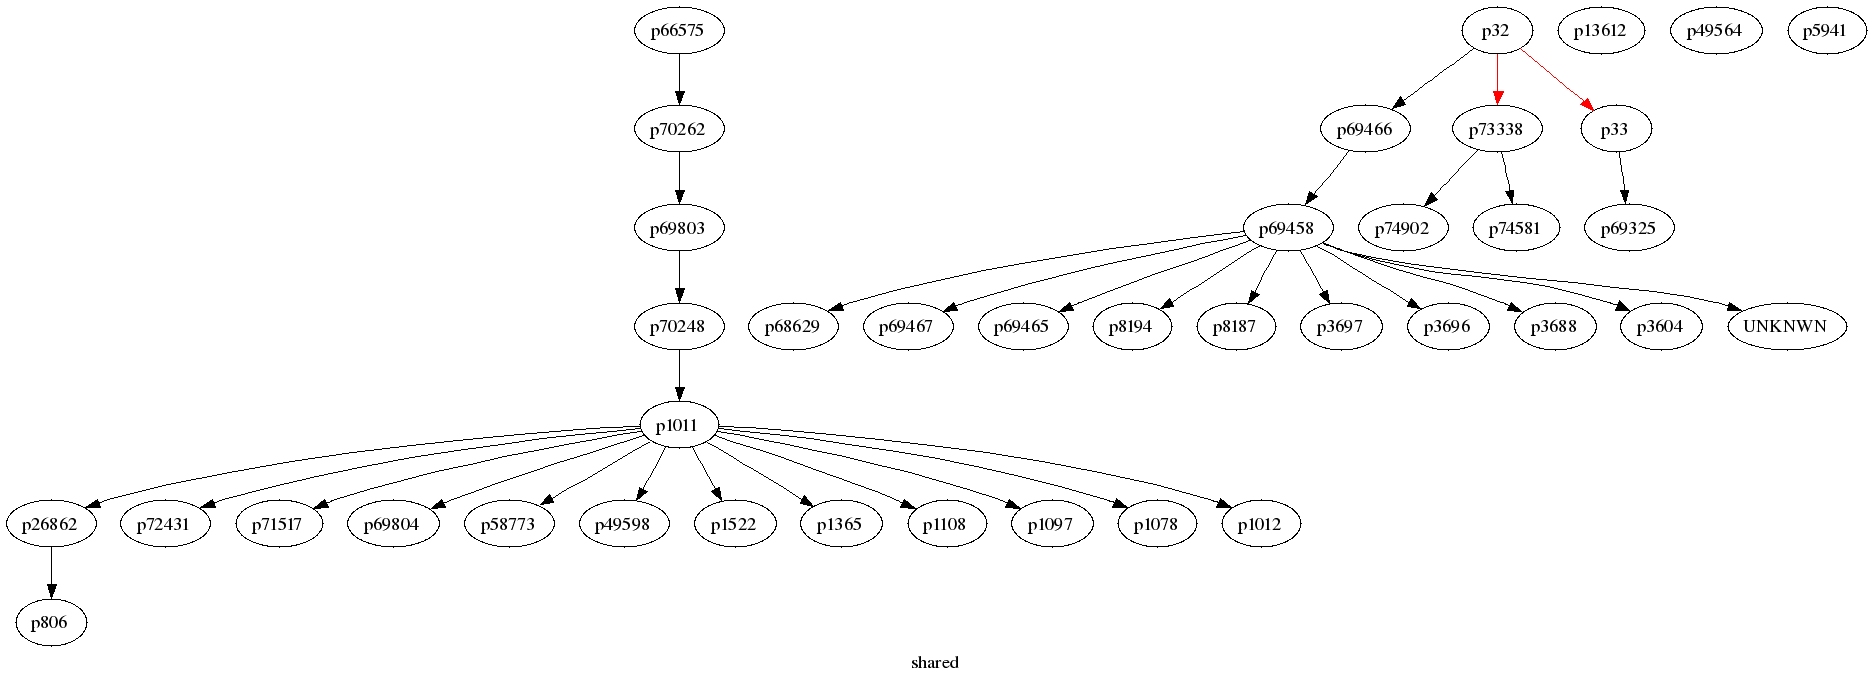
Marc,
I seriously doubt that the problems machine experiencing is deadlock.

At the http://people.freebsd.org/~kib/e1.gif is the graph of the locking
dependencies for the vnode locks. The edge from process a to process b means
that process a holds a lock and process b is waiting for the lock. Black
edge means dependency by the vnode lock, red edge - by the buffer lock.

As you see, graph is acyclic. Basically, there are two groups of the
processes that a blocked: one hierarchy rooted in the pid 66575, this one
includes shell 806. Second one is rooted in the process 32.

What are they doing ? Pid 66575:

Tracing command smtpd pid 66575 tid 101396 td 0xceb0a180
sched_switch(ceb0a180,0,1) at sched_switch+0x177
mi_switch(1,0) at mi_switch+0x270
sleepq_switch(dc5b5b20,c0661b60,0,c05fd078,20c) at sleepq_switch+0xc1
sleepq_wait(dc5b5b20,0,c0601d10,e59,8) at sleepq_wait+0x46
msleep(dc5b5b20,c06afde0,44,c061021d,0) at msleep+0x279
bwait(dc5b5b20,44,c061021d) at bwait+0x47
vnode_pager_generic_getpages(c8e85000,ed347c80,1000,0,c8e22000) at
vnode_pager_generic_getpages+0x777
ffs_getpages(ed347bbc,c8e85000,0,ed347be8,c0597c41) at ffs_getpages+0x100
VOP_GETPAGES_APV(c063c100,ed347bbc) at VOP_GETPAGES_APV+0xa9
vnode_pager_getpages(c8e22000,ed347c80,1,0) at vnode_pager_getpages+0xa5
vm_fault(c88da4a0,280bb000,1,0,ceb0a180) at vm_fault+0x980
trap_pfault(ed347d38,1,280bb000,280bb000,0) at trap_pfault+0xce
trap(3b,3b,3b,8078d1c,807952c) at trap+0x1eb
calltrap() at calltrap+0x5
--- trap 0xc, eip = 0x280baffd, esp = 0xbfbfe894, ebp = 0xbfbfe8d8 ---

This process waits for the data to be paged in.

Pid 32 (syncer)

Tracing command syncer pid 32 tid 100033 td 0xc8544780
sched_switch(c8544780,0,1) at sched_switch+0x177
mi_switch(1,0) at mi_switch+0x270
sleepq_switch(dc79fe68,c0661b60,0,c05fd078,20c) at sleepq_switch+0xc1
sleepq_wait(dc79fe68,0,c0601d10,e59,c06039a0) at sleepq_wait+0x46
msleep(dc79fe68,c06afde0,4c,c06024dc,0) at msleep+0x279
bwait(dc79fe68,4c,c06024dc) at bwait+0x47
bufwait(dc79fe68,1,0,0,0) at bufwait+0x1a
breadn(c8a0b414,6537700,0,4000,0) at breadn+0x266
bread(c8a0b414,6537700,0,4000,0) at bread+0x20
ffs_update(c9992000,0,6,0,0) at ffs_update+0x228
ffs_syncvnode(c9992000,3) at ffs_syncvnode+0x3be
ffs_sync(c8831400,3,c8544780,c8831400,2) at ffs_sync+0x209
sync_fsync(e817fcbc,c8a11ae0,c8a11bec,e817fcd8,c04ed586) at sync_fsync+0x126
VOP_FSYNC_APV(c0634220,e817fcbc) at VOP_FSYNC_APV+0x9b
sync_vnode(c8a11bec,c8544780) at sync_vnode+0x106
sched_sync(0,e817fd38,0,c04ed614,0) at sched_sync+0x1ed
fork_exit(c04ed614,0,e817fd38) at fork_exit+0xa0
fork_trampoline() at fork_trampoline+0x8
--- trap 0x1, eip = 0, esp = 0xe817fd6c, ebp = 0 ---

also waits for the data.

What happens with blocks ?
syncer (pid 32) locked block 0xc8a0b414 and waits for data (as shown before).
Processes 33 (softdepflush), umount (pid 73338) waits for this block.

You did not provided the output of "show lockedbufs",
but, even without that data, I doubt that the buf subsystem deadlocked by
itself.

I make an conjecture that the problem is either with you disk hardware (i.e.,
actual hard drive or disk controller), or in the controller driver.

At least, you could show us the dmesg.
![]() pgpBGmm7iDLMA.pgp
pgpBGmm7iDLMA.pgp
Description: PGP signature