Randy Read's paper in latest Acta D:

Measuring and using information gained by observing diffraction data
http://journals.iucr.org/d/issues/2020/03/00/ba5308/index.html
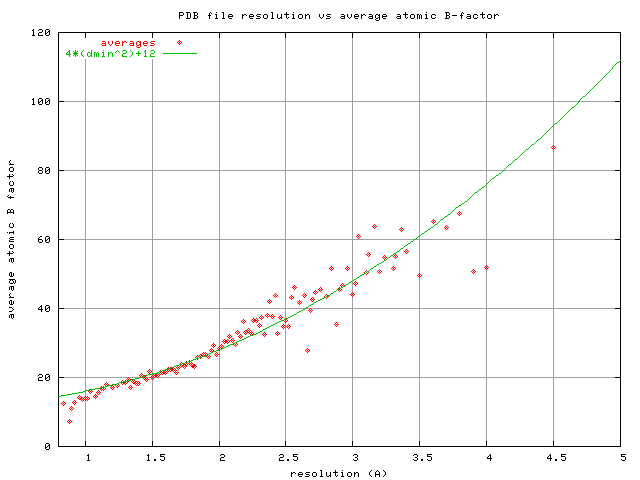
seems very relevant to this discussion!

Pavel


On Fri, Mar 6, 2020 at 8:44 AM James Holton <[email protected]> wrote:

> Thank you Kay,
>
> Very good points, as always.  I was thinking there must be a better
> apodization filter than cutoffs and B factors.  I'll have to try a
> CC1/2-based roll-off.  But, I wonder if this could be done better on a
> per-reflection basis?  Taking advantage of the sigmas?  I have tried
> using 1/sigma^2 as a weight in map calculation, and that makes the map
> look really weird.  Your idea makes more sense.
>
> On the other hand, the French-Wilson (F&W) truncation procedure is
> supposed to come up with the maximum-likelihood Fourier coefficient
> given the observed intensity and sigma(intensity).  So, the "F" values
> we get from truncate or xdsconv should already be "good"?  Maybe the
> problem is that we are sharpening after the F&W step, rather than
> before?  Or maybe the problem is that F&W bottoms out around F=sig(F).
> Your proposed weight might finish the job...
>
> As for sigmaA, one thing I do know is that refmac5 now uses experimental
> sigmas by default.  Phenix.refine does not.
>
> One thing is for sure, sharpening the data before refinement is not
> going to become a popular strategy.  This is because pre-sharpened data
> will make Rwork and Rfree higher than they are with the "natural" B
> factor.  You can also make your Rwork Rfree much lower by applying a
> positive B factor to your data before starting refinement.  This comes
> with absolutely no improvement in model quality, so please don't try
> this at home.
>
> -James Holton
> MAD Scientist
>
> On 3/5/2020 9:38 PM, Kay Diederichs wrote:
> > Dear James,
> >
> > important and educational points! This triggers some thoughts ...
> >
> > The one point where I don't quite agree is with "What about filtering
> out the noise?  An ideal noise suppression filter has the same shape as the
> signal (I found that in Numerical Recipes), and the shape of the signal
> from a macromolecule is a Gaussian in reciprocal space (aka straight line
> on a Wilson plot). This is true, by the way, for both a molecule packed
> into a crystal or free in solution.  So, the ideal noise-suppression filter
> is simply applying a B factor.  "
> >
> > I think we can do better than that. We should use the knowledge about
> the actual signal and its noise (which we measure) as a weighting factor,
> rather than that of the theoretical signal (the straight line in the Wilson
> plot), for the purpose of noise suppression. Formula 13.3.6 in Numerical
> Recipes (3rd ed., 2007), which gives the optimal (Wiener) filter to be used
> for weighting, is phi(f) = S(f)^2/(S(f)^2 + N(f)^2)  . But at high
> resolution, this is just CC1/2: see Box 1 of reference (1) - the formula
> CC1/2 = 1/(1 + 2/(I/sigma)^2 can be written as CC1/2 = <I>^2/(<I>^2 + 2
> <sigma>^2) where sigma is the estimate of the noise in I ; don't know right
> now why there is a factor of 2).  This goes to zero at the resolution where
> the signal goes to zero, and is near one in the resolution range in which
> we have good knowledge of the signal.
> > (I only thought about this today, and I also considered CC* as a
> weighting factor, as I understand is suggested by Rosenthal and Henderson,
> J.Mol.Biol. 2003, but I cannot convince myself currently that this is
> right. Anyway, the shape of the CC* curve as a function of resolution
> matches that of CC1/2)
> > In other words, we should be able to suppress the noise by multiplying
> the Fourier coefficients used for map calculation with (a smooth
> resolution-dependent approximation of) CC1/2. This should allow to sharpen,
> with the best noise suppression we can get.
> >
> > Thinking about this, we are already typically using weighted Fourier
> coefficients of the form 2mFobs-DFcalc for map calculation. Aren't these
> already weighted in the correct way? I think not - those m and D weights
> are calculated from estimates of model (in-)accuracy and (in-)completeness,
> but don't properly take the measurement errors into account. Of course,
> since noisy data make the sigmaA values worse, the noise in the data
> influences sigmaA, but not in the functionally correct form. To my
> understanding, the correct way to take account of both model and data
> errors is given by reference (2), which - to my knowledge - is not yet
> implemented except in PHASER.
> >
> > Hope this makes sense!
> >
> > Kay
> >
> > References:
> > (1) Karplus & Diederichs (2015) Assessing and maximizing data quality in
> macromolecular crystallography.
> > Curr. Opin. Struct. Biol. 34, 60-68 . PDF at
> https://www.biologie.uni-konstanz.de/typo3temp/secure_downloads/82815/0/2b10c9e6f9a28129e1b119d21aeeab217c918bb1/Karplus2015_CurrOpinStructBiol.pdf
> > (2) RJ Read, AJ McCoy (2016) A log-likelihood-gain intensity target for
> crystallographic phasing that accounts for experimental error. Acta
> Crystallographica Section D: Structural Biology 72 (3), 375-387
> > https://scripts.iucr.org/cgi-bin/paper?dz5382
> >
> > On Thu, 5 Mar 2020 01:11:33 +0100, James Holton <[email protected]>
> wrote:
> >
> >> The funny thing is, although we generally regard resolution as a primary
> >> indicator of data quality the appearance of a density map at the classic
> >> "1-sigma" contour has very little to do with resolution, and everything
> >> to do with the B factor.
> >>
> >> Seriously, try it. Take any structure you like, set all the B factors to
> >> 30 with PDBSET, calculate a map with SFALL or phenix.fmodel and have a
> >> look at the density of tyrosine (Tyr) side chains.  Even if you
> >> calculate structure factors all the way out to 1.0 A the holes in the
> >> Tyr rings look exactly the same: just barely starting to form.  This is
> >> because the structure factors from atoms with B=30 are essentially zero
> >> out at 1.0 A, and adding zeroes does not change the map.  You can adjust
> >> the contour level, of course, and solvent content will have some effect
> >> on where the "1-sigma" contour lies, but generally B=30 is the point
> >> where Tyr side chains start to form their holes.  Traditionally, this is
> >> attributed to 1.8A resolution, but it is really at B=30.  The point
> >> where waters first start to poke out above the 1-sigma contour is at
> >> B=60, despite being generally attributed to d=2.7A.
> >>
> >> Now, of course, if you cut off this B=30 data at 3.5A then the Tyr side
> >> chains become blobs, but that is equivalent to collecting data with the
> >> detector way too far away and losing your high-resolution spots off the
> >> edges.  I have seen a few people do that, but not usually for a
> >> published structure.  Most people fight very hard for those faint,
> >> barely-existing high-angle spots.  But why do we do that if the map is
> >> going to look the same anyway?  The reason is because resolution and B
> >> factors are linked.
> >>
> >> Resolution is about separation vs width, and the width of the density
> >> peak from any atom is set by its B factor.  Yes, atoms have an intrinsic
> >> width, but it is very quickly washed out by even modest B factors (B >
> >> 10).  This is true for both x-ray and electron form factors. To a very
> >> good approximation, the FWHM of C, N and O atoms is given by:
> >> FWHM= sqrt(B*log(2))/pi+0.15
> >>
> >> where "B" is the B factor assigned to the atom and the 0.15 fudge factor
> >> accounts for its intrinsic width when B=0.  Now that we know the peak
> >> width, we can start to ask if two peaks are "resolved".
> >>
> >> Start with the classical definition of "resolution" (call it after Airy,
> >> Raleigh, Dawes, or whatever famous person you like), but essentially you
> >> are asking the question: "how close can two peaks be before they merge
> >> into one peak?".  For Gaussian peaks this is 0.849*FWHM. Simple enough.
> >> However, when you look at the density of two atoms this far apart you
> >> will see the peak is highly oblong. Yes, the density has one maximum,
> >> but there are clearly two atoms in there.  It is also pretty obvious the
> >> long axis of the peak is the line between the two atoms, and if you fit
> >> two round atoms into this peak you recover the distance between them
> >> quite accurately.  Are they really not "resolved" if it is so clear
> >> where they are?
> >>
> >> In such cases you usually want to sharpen, as that will make the oblong
> >> blob turn into two resolved peaks.  Sharpening reduces the B factor and
> >> therefore FWHM of every atom, making the "resolution" (0.849*FWHM) a
> >> shorter distance.  So, we have improved resolution with sharpening!  Why
> >> don't we always do this?  Well, the reason is because of noise.
> >> Sharpening up-weights the noise of high-order Fourier terms and
> >> therefore degrades the overall signal-to-noise (SNR) of the map.  This
> >> is what I believe Colin would call reduced "contrast".  Of course, since
> >> we view maps with a threshold (aka contour) a map with SNR=5 will look
> >> almost identical to a map with SNR=500. The "noise floor" is generally
> >> well below the 1-sigma threshold, or even the 0-sigma threshold
> >> (https://doi.org/10.1073/pnas.1302823110).  As you turn up the
> >> sharpening you will see blobs split apart and also see new peaks rising
> >> above your map contouring threshold.  Are these new peaks real?  Or are
> >> they noise?  That is the difference between SNR=500 and SNR=5,
> >> respectively.  The tricky part of sharpening is knowing when you have
> >> reached the point where you are introducing more noise than signal.
> >> There are some good methods out there, but none of them are perfect.
> >>
> >> What about filtering out the noise?  An ideal noise suppression filter
> >> has the same shape as the signal (I found that in Numerical Recipes),
> >> and the shape of the signal from a macromolecule is a Gaussian in
> >> reciprocal space (aka straight line on a Wilson plot). This is true, by
> >> the way, for both a molecule packed into a crystal or free in solution.
> >> So, the ideal noise-suppression filter is simply applying a B factor.
> >> Only problem is: sharpening is generally done by applying a negative B
> >> factor, so applying a Gaussian blur is equivalent to just not sharpening
> >> as much. So, we are back to "optimal sharpening" again.
> >>
> >> Why not use a filter that is non-Gaussian?  We do this all the time!
> >> Cutting off the data at a given resolution (d) is equivalent to blurring
> >> the map with this function:
> >>
> >> kernel_d(r) = 4/3*pi/d**3*sinc3(2*pi*r/d)
> >> sinc3(x) = (x==0?1:3*(sin(x)/x-cos(x))/(x*x))
> >>
> >> where kernel_d(r) is the normalized weight given to a point "r" Angstrom
> >> away from the center of each blurring operation, and "sinc3" is the
> >> Fourier synthesis of a solid sphere.  That is, if you make an HKL file
> >> with all F=1 and PHI=0 out to a resolution d, then effectively all hkls
> >> beyond the resolution limit are zero. If you calculate a map with those
> >> Fs, you will find the kernel_d(r) function at the origin.  What that
> >> means is: by applying a resolution cutoff, you are effectively
> >> multiplying your data by this sphere of unit Fs, and since a
> >> multiplication in reciprocal space is a convolution in real space, the
> >> effect is convoluting (blurring) with kernel_d(x).
> >>
> >> For comparison, if you apply a B factor, the real-space blurring kernel
> >> is this:
> >> kernel_B(r) = (4*pi/B)**1.5*exp(-4*pi**2/B*r*r)
> >>
> >> If you graph these two kernels (format is for gnuplot) you will find
> >> that they have the same FWHM whenever B=80*(d/3)**2.  This "rule" is the
> >> one I used for my resolution demonstration movie I made back in the late
> >> 20th century:
> >> https://bl831.als.lbl.gov/~jamesh/movies/index.html#resolution
> >>
> >> What I did then was set all atomic B factors to B = 80*(d/3)^2 and then
> >> cut the resolution at "d".  Seemed sensible at the time.  I suppose I
> >> could have used the PDB-wide average atomic B factor reported for
> >> structures with resolution "d", which roughly follows:
> >> B = 4*d**2+12
> >> https://bl831.als.lbl.gov/~jamesh/pickup/reso_vs_avgB.png
> >>
> >> The reason I didn't use this formula for the movie is because I didn't
> >> figure it out until about 10 years later.  These two curves cross at
> >> 1.5A, but diverge significantly at poor resolution.  So, which one is
> >> right?  It depends on how well you can measure really really faint
> >> spots, and we've been getting better at that in recent decades.
> >>
> >> So, what I'm trying to say here is that just because your data has CC1/2
> >> or FSC dropping off to insignificance at 1.8 A doesn't mean you are
> >> going to see holes in Tyr side chains.  However, if you measure your
> >> weak, high-res data really well (high multiplicity), you might be able
> >> to sharpen your way to a much clearer map.
> >>
> >> -James Holton
> >> MAD Scientist
> >>
> >> On 2/27/2020 11:01 AM, Nave, Colin (DLSLtd,RAL,LSCI) wrote:
> >>> James
> >>>
> >>> All you say seems sensible to me but there is the possibility of
> >>> confusion regarding the use of the word threshold. I fully agree that
> >>> a half bit information threshold is inappropriate if it is taken to
> >>> mean that the data should be truncated at that resolution. The ever
> >>> more sophisticated refinement programs are becoming adept at handling
> >>> the noisy data.
> >>>
> >>> The half bit information threshold I was discussing refers to a
> >>> nominal resolution. This is not just for trivial reporting purposes.
> >>> The half bit threshold is being used to compare imaging methods and
> >>> perhaps demonstrate that significant information is present with a
> >>> dose below any radiation damage threshold (that word again). The
> >>> justification for doing this appears to come from the fact it has been
> >>> adopted for protein structure determination by single particle
> >>> electron microscopy. However, low contrast features might not be
> >>> visible at this nominal resolution.
> >>>
> >>> The analogy with protein crystallography might be to collect data
> >>> below an absorption edge to give a nominal resolution of 2 angstrom.
> >>> Then do it again well above the absorption edge. The second one gives
> >>> much greater Bijvoet differences despite the fact that the nominal
> >>> resolution is the same. I doubt whether anyone doing this would be
> >>> misled by this as they would examine the statistics for the Bijvoet
> >>> differences instead. However, it does indicate the relationship
> >>> between contrast and resolution.
> >>>
> >>> The question, if referring to an information threshold for nominal
> >>> resolution, could be “Is there significant information in the data at
> >>> the required contrast and resolution?”. Then “Can one obtain this
> >>> information at a dose below any radiation damage limit”
> >>>
> >>> Keep posting!
> >>>
> >>> Regards
> >>>
> >>> Colin
> >>>
> >>> *From:*James Holton <[email protected]>
> >>> *Sent:* 27 February 2020 01:14
> >>> *To:* [email protected]
> >>> *Cc:* Nave, Colin (DLSLtd,RAL,LSCI) <[email protected]>
> >>> *Subject:* Re: [ccp4bb] [3dem] Which resolution?
> >>>
> >>> In my opinion the threshold should be zero bits.  Yes, this is where
> >>> CC1/2 = 0 (or FSC = 0).  If there is correlation then there is
> >>> information, and why throw out information if there is information to
> >>> be had?  Yes, this information comes with noise attached, but that is
> >>> why we have weights.
> >>>
> >>> It is also important to remember that zero intensity is still useful
> >>> information.  Systematic absences are an excellent example.  They have
> >>> no intensity at all, but they speak volumes about the structure.  In a
> >>> similar way, high-angle zero-intensity observations also tell us
> >>> something.  Ever tried unrestrained B factor refinement at poor
> >>> resolution?  It is hard to do nowadays because of all the safety
> >>> catches in modern software, but you can get great R factors this way.
> >>> A telltale sign of this kind of "over fitting" is remarkably large
> >>> Fcalc values beyond the resolution cutoff.  These don't contribute to
> >>> the R factor, however, because Fobs is missing for these hkls. So,
> >>> including zero-intensity data suppresses at least some types of
> >>> over-fitting.
> >>>
> >>> The thing I like most about the zero-information resolution cutoff is
> >>> that it forces us to address the real problem: what do you mean by
> >>> "resolution" ?  Not long ago, claiming your resolution was 3.0 A meant
> >>> that after discarding all spots with individual I/sigI < 3 you still
> >>> have 80% completeness in the 3.0 A bin.  Now we are saying we have a
> >>> 3.0 A data set when we can prove statistically that a few
> >>> non-background counts fell into the sum of all spot areas at 3.0 A.
> >>> These are not the same thing.
> >>>
> >>> Don't get me wrong, including the weak high-resolution information
> >>> makes the model better, and indeed I am even advocating including all
> >>> the noisy zeroes.  However, weak data at 3.0 A is never going to be as
> >>> good as having strong data at 3.0 A.  So, how do we decide?  I
> >>> personally think that the resolution assigned to the PDB deposition
> >>> should remain the classical I/sigI > 3 at 80% rule.  This is really
> >>> the only way to have meaningful comparison of resolution between very
> >>> old and very new structures.  One should, of course, deposit all the
> >>> data, but don't claim that cut-off as your "resolution".  That is just
> >>> plain unfair to those who came before.
> >>>
> >>> Oh yeah, and I also have a session on "interpreting low-resolution
> >>> maps" at the GRC this year.
> >>>
> https://www.grc.org/diffraction-methods-in-structural-biology-conference/2020/
> >>>
> >>> So, please, let the discussion continue!
> >>>
> >>> -James Holton
> >>> MAD Scientist
> >>>
> >>> On 2/22/2020 11:06 AM, Nave, Colin (DLSLtd,RAL,LSCI) wrote:
> >>>
> >>>      Alexis
> >>>
> >>>      This is a very useful summary.
> >>>
> >>>      You say you were not convinced by Marin's derivation in 2005. Are
> >>>      you convinced now and, if not, why?
> >>>
> >>>      My interest in this is that the FSC with half bit thresholds have
> >>>      the danger of being adopted elsewhere because they are becoming
> >>>      standard for protein structure determination (by EM or MX). If it
> >>>      is used for these mature techniques it must be right!
> >>>
> >>>      It is the adoption of the ½ bit threshold I worry about. I gave a
> >>>      rather weak example for MX which consisted of partial occupancy of
> >>>      side chains, substrates etc. For x-ray imaging a wide range of
> >>>      contrasts can occur and, if you want to see features with only a
> >>>      small contrast above the surroundings then I think the half bit
> >>>      threshold would be inappropriate.
> >>>
> >>>      It would be good to see a clear message from the MX and EM
> >>>      communities as to why an information content threshold of ½ a bit
> >>>      is generally appropriate for these techniques and an
> >>>      acknowledgement that this threshold is technique/problem
> dependent.
> >>>
> >>>      We might then progress from the bronze age to the iron age.
> >>>
> >>>      Regards
> >>>
> >>>      Colin
> >>>
> >>>      *From:*CCP4 bulletin board <[email protected]>
> >>>      <mailto:[email protected]> *On Behalf Of *Alexis Rohou
> >>>      *Sent:* 21 February 2020 16:35
> >>>      *To:* [email protected] <mailto:[email protected]>
> >>>      *Subject:* Re: [ccp4bb] [3dem] Which resolution?
> >>>
> >>>      Hi all,
> >>>
> >>>      For those bewildered by Marin's insistence that everyone's been
> >>>      messing up their stats since the bronze age, I'd like to offer
> >>>      what my understanding of the situation. More details in this
> >>>      thread from a few years ago on the exact same topic:
> >>>
> >>>
> https://mail.ncmir.ucsd.edu/pipermail/3dem/2015-August/003939.html
> >>>
> >>>
> https://mail.ncmir.ucsd.edu/pipermail/3dem/2015-August/003944.html
> >>>
> >>>      Notwithstanding notational problems (e.g. strict equations as
> >>>      opposed to approximation symbols, or omission of symbols to denote
> >>>      estimation), I believe Frank & Al-Ali and "descendent" papers
> >>>      (e.g. appendix of Rosenthal & Henderson 2003) are fine. The cross
> >>>      terms that Marin is agitated about indeed do in fact have an
> >>>      expectation value of 0.0 (in the ensemble; if the experiment were
> >>>      performed an infinite number of times with different realizations
> >>>      of noise). I don't believe Pawel or Jose Maria or any of the other
> >>>      authors really believe that the cross-terms are orthogonal.
> >>>
> >>>      When N (the number of independent Fouier voxels in a shell) is
> >>>      large enough, mean(Signal x Noise) ~ 0.0 is only an approximation,
> >>>      but a pretty good one, even for a single FSC experiment. This is
> >>>      why, in my book, derivations that depend on Frank & Al-Ali are OK,
> >>>      under the strict assumption that N is large. Numerically, this
> >>>      becomes apparent when Marin's half-bit criterion is plotted -
> >>>      asymptotically it has the same behavior as a constant threshold.
> >>>
> >>>      So, is Marin wrong to worry about this? No, I don't think so.
> >>>      There are indeed cases where the assumption of large N is broken.
> >>>      And under those circumstances, any fixed threshold (0.143, 0.5,
> >>>      whatever) is dangerous. This is illustrated in figures of van Heel
> >>>      & Schatz (2005). Small boxes, high-symmetry, small objects in
> >>>      large boxes, and a number of other conditions can make fixed
> >>>      thresholds dangerous.
> >>>
> >>>      It would indeed be better to use a non-fixed threshold. So why am
> >>>      I not using the 1/2-bit criterion in my own work? While
> >>>      numerically it behaves well at most resolution ranges, I was not
> >>>      convinced by Marin's derivation in 2005. Philosophically though, I
> >>>      think he's right - we should aim for FSC thresholds that are more
> >>>      robust to the kinds of edge cases mentioned above. It would be the
> >>>      right thing to do.
> >>>
> >>>      Hope this helps,
> >>>
> >>>      Alexis
> >>>
> >>>      On Sun, Feb 16, 2020 at 9:00 AM Penczek, Pawel A
> >>>      <[email protected] <mailto:[email protected]
> >>
> >>>      wrote:
> >>>
> >>>          Marin,
> >>>
> >>>          The statistics in 2010 review is fine. You may disagree with
> >>>          assumptions, but I can assure you the “statistics” (as you
> >>>          call it) is fine. Careful reading of the paper would reveal to
> >>>          you this much.
> >>>
> >>>          Regards,
> >>>
> >>>          Pawel
> >>>
> >>>
> >>>
> >>>
> >>>              On Feb 16, 2020, at 10:38 AM, Marin van Heel
> >>>              <[email protected]
> >>>              <mailto:[email protected]>> wrote:
> >>>
> >>>
> >>>
> >>>              ***** EXTERNAL EMAIL *****
> >>>
> >>>              Dear Pawel and All others ....
> >>>
> >>>              This 2010 review is - unfortunately - largely based on the
> >>>              flawed statistics I mentioned before, namely on the a
> >>>              priori assumption that the inner product of a signal
> >>>              vector and a noise vector are ZERO (an orthogonality
> >>>              assumption).  The (Frank & Al-Ali 1975) paper we have
> >>>              refuted on a number of occasions (for example in 2005, and
> >>>              most recently in our BioRxiv paper) but you still take
> >>>              that as the correct relation between SNR and FRC (and you
> >>>              never cite the criticism...).
> >>>
> >>>              Sorry
> >>>
> >>>              Marin
> >>>
> >>>              On Thu, Feb 13, 2020 at 10:42 AM Penczek, Pawel A
> >>>              <[email protected]
> >>>              <mailto:[email protected]>> wrote:
> >>>
> >>>                  Dear Teige,
> >>>
> >>>                  I am wondering whether you are familiar with
> >>>
> >>>
> >>>                      Resolution measures in molecular electron
> microscopy.
> >>>
> >>>                  Penczek PA. Methods Enzymol. 2010.
> >>>
> >>>
> >>>                        Citation
> >>>
> >>>                  Methods Enzymol. 2010;482:73-100. doi:
> >>>                  10.1016/S0076-6879(10)82003-8.
> >>>
> >>>                  You will find there answers to all questions you asked
> >>>                  and much more.
> >>>
> >>>                  Regards,
> >>>
> >>>                  Pawel Penczek
> >>>
> >>>                  Regards,
> >>>
> >>>                  Pawel
> >>>
> >>>                  _______________________________________________
> >>>                  3dem mailing list
> >>>                  [email protected] <mailto:[email protected]>
> >>>                  https://mail.ncmir.ucsd.edu/mailman/listinfo/3dem
> >>>                  <
> https://urldefense.proofpoint.com/v2/url?u=https-3A__mail.ncmir.ucsd.edu_mailman_listinfo_3dem&d=DwMFaQ&c=bKRySV-ouEg_AT-w2QWsTdd9X__KYh9Eq2fdmQDVZgw&r=yEYHb4SF2vvMq3W-iluu41LlHcFadz4Ekzr3_bT4-qI&m=3-TZcohYbZGHCQ7azF9_fgEJmssbBksaI7ESb0VIk1Y&s=XHMq9Q6Zwa69NL8kzFbmaLmZA9M33U01tBE6iAtQ140&e=
> >
> >>>
> >>>          _______________________________________________
> >>>          3dem mailing list
> >>>          [email protected] <mailto:[email protected]>
> >>>          https://mail.ncmir.ucsd.edu/mailman/listinfo/3dem
> >>>
> >>>
> ------------------------------------------------------------------------
> >>>
> >>>      To unsubscribe from the CCP4BB list, click the following link:
> >>>      https://www.jiscmail.ac.uk/cgi-bin/webadmin?SUBED1=CCP4BB&A=1
> >>>
> >>>      --
> >>>
> >>>      This e-mail and any attachments may contain confidential,
> >>>      copyright and or privileged material, and are for the use of the
> >>>      intended addressee only. If you are not the intended addressee or
> >>>      an authorised recipient of the addressee please notify us of
> >>>      receipt by returning the e-mail and do not use, copy, retain,
> >>>      distribute or disclose the information in or attached to the
> e-mail.
> >>>      Any opinions expressed within this e-mail are those of the
> >>>      individual and not necessarily of Diamond Light Source Ltd.
> >>>      Diamond Light Source Ltd. cannot guarantee that this e-mail or any
> >>>      attachments are free from viruses and we cannot accept liability
> >>>      for any damage which you may sustain as a result of software
> >>>      viruses which may be transmitted in or with the message.
> >>>      Diamond Light Source Limited (company no. 4375679). Registered in
> >>>      England and Wales with its registered office at Diamond House,
> >>>      Harwell Science and Innovation Campus, Didcot, Oxfordshire, OX11
> >>>      0DE, United Kingdom
> >>>
> >>>
> ------------------------------------------------------------------------
> >>>
> >>>      To unsubscribe from the CCP4BB list, click the following link:
> >>>      https://www.jiscmail.ac.uk/cgi-bin/webadmin?SUBED1=CCP4BB&A=1
> >>>
> >>> --
> >>>
> >>> This e-mail and any attachments may contain confidential, copyright
> >>> and or privileged material, and are for the use of the intended
> >>> addressee only. If you are not the intended addressee or an authorised
> >>> recipient of the addressee please notify us of receipt by returning
> >>> the e-mail and do not use, copy, retain, distribute or disclose the
> >>> information in or attached to the e-mail.
> >>> Any opinions expressed within this e-mail are those of the individual
> >>> and not necessarily of Diamond Light Source Ltd.
> >>> Diamond Light Source Ltd. cannot guarantee that this e-mail or any
> >>> attachments are free from viruses and we cannot accept liability for
> >>> any damage which you may sustain as a result of software viruses which
> >>> may be transmitted in or with the message.
> >>> Diamond Light Source Limited (company no. 4375679). Registered in
> >>> England and Wales with its registered office at Diamond House, Harwell
> >>> Science and Innovation Campus, Didcot, Oxfordshire, OX11 0DE, United
> >>> Kingdom
> >>>
> >>
> >> ########################################################################
> >>
> >> To unsubscribe from the CCP4BB list, click the following link:
> >> https://www.jiscmail.ac.uk/cgi-bin/webadmin?SUBED1=CCP4BB&A=1
> >>
> > ########################################################################
> >
> > To unsubscribe from the CCP4BB list, click the following link:
> > https://www.jiscmail.ac.uk/cgi-bin/webadmin?SUBED1=CCP4BB&A=1
>
> ########################################################################
>
> To unsubscribe from the CCP4BB list, click the following link:
> https://www.jiscmail.ac.uk/cgi-bin/webadmin?SUBED1=CCP4BB&A=1
>

########################################################################

To unsubscribe from the CCP4BB list, click the following link:
https://www.jiscmail.ac.uk/cgi-bin/webadmin?SUBED1=CCP4BB&A=1