Excellent, that is very helpful.

Here's a simpler nginx.conf to reproduce. Note that the leak goes away
if you don't use Connection: Upgrade.
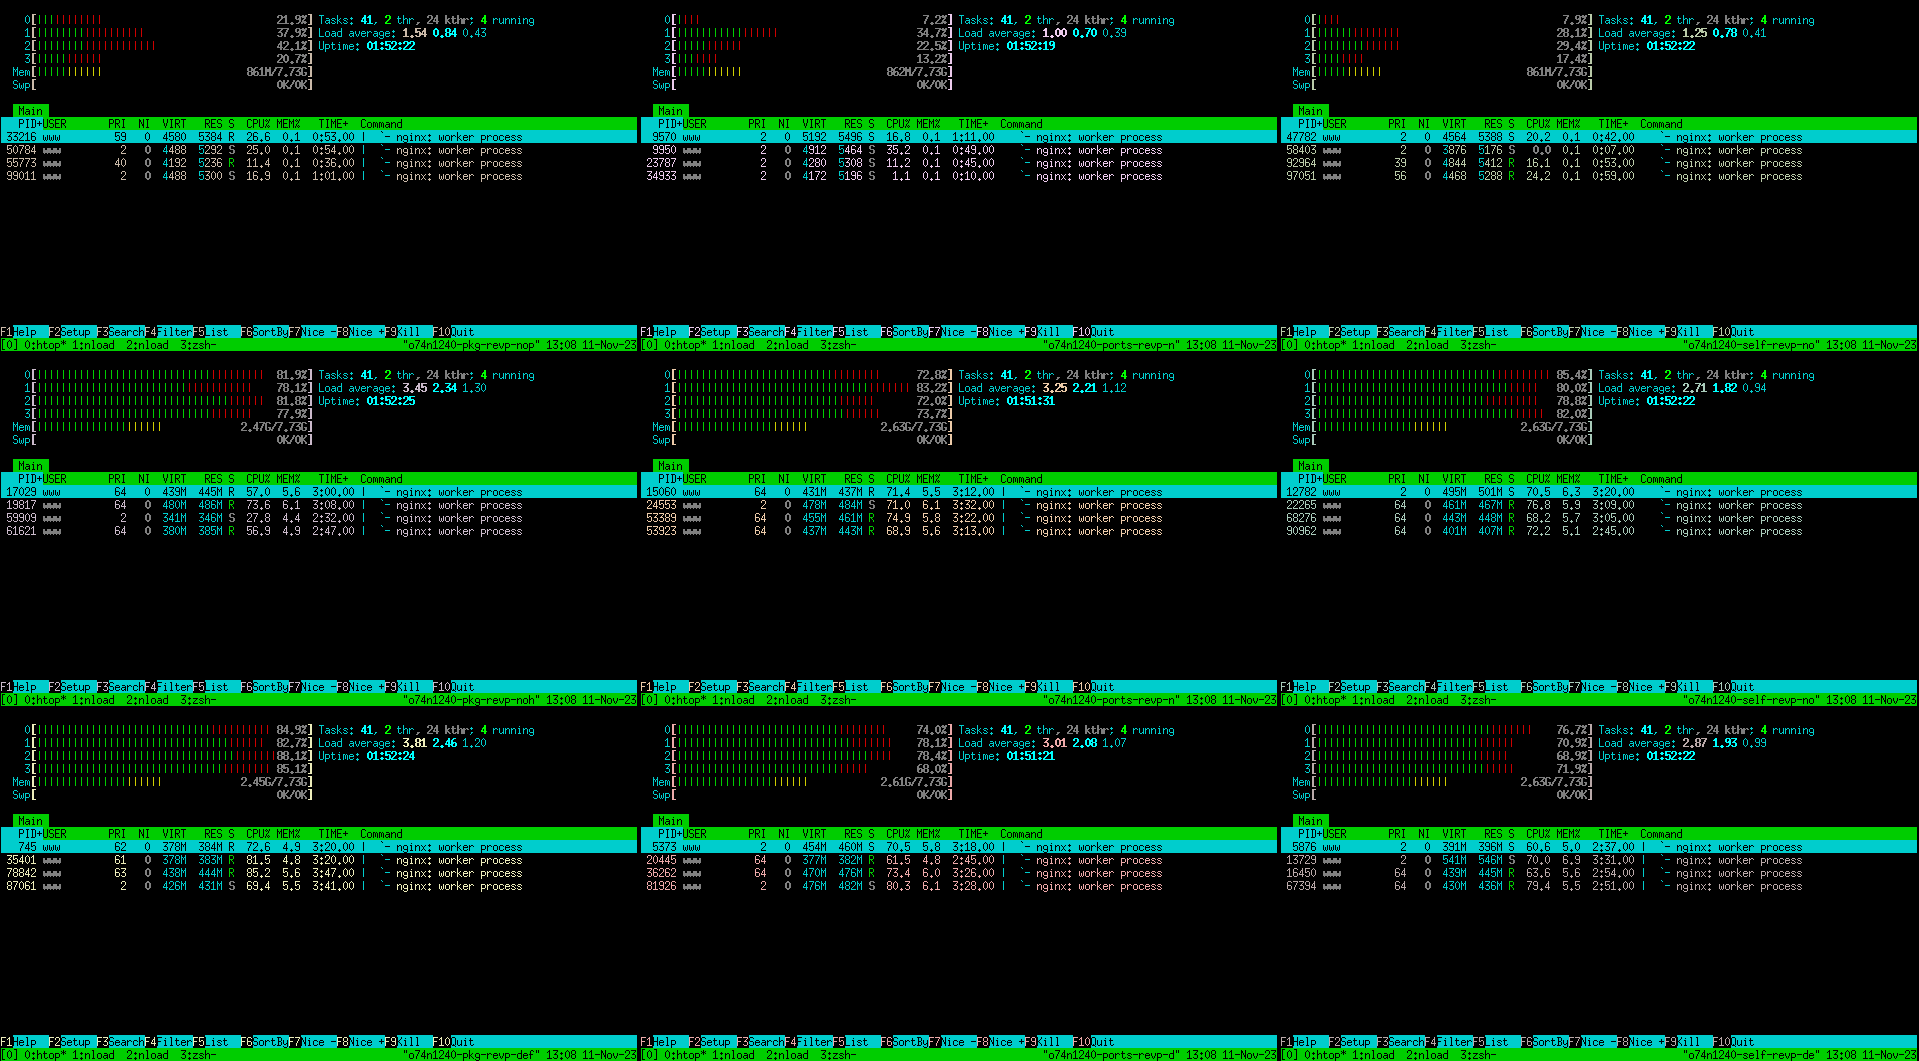
Simple test tool:

pkg_add http_load
echo http://127.0.0.1:8123/ > /tmp/urls
http_load -rate 100 -seconds 10 /tmp/urls


--------
worker_processes  4;
worker_rlimit_nofile 1024;
events {
        worker_connections  800;
}

http {
        server {
                listen       127.0.0.1:8123;
                server_name  localhost;
                root         /var/www/htdocs;

                location / {
                        proxy_pass https://sym.spacehopper.org/;
                        proxy_http_version 1.1;

                        proxy_set_header Connection "Upgrade";

                        #proxy_ssl_protocols TLSv1.2;
                        proxy_ssl_protocols TLSv1.3;
                }
        }
}
--------


On 2023/11/11 14:20, Tobias Fiebig wrote:
>
> Moin,I ran through the experiments i had suggested. As you assumed, this is
> indeed related to outbound TLS1.3 connections, specifically:
>
> +---------------------------------------------------------------------+
> | Config (syspatched OpenBSD 7.4)                         | Memleak?  |
> +---------------------------------------------------------+-----------+
> | From pkg, TLS1.3 for in and outbound                    | Yes       |
> | From pkg, no TLS1.3 for inbound                         | Yes       |
> | From pkg, no TLS1.3 for outbound                        | No        |
> |                                                         |           |
> | From ports, TLS1.3 for in and outbound, sub_http module | Yes       |
> | From ports, no TLS1.3 for inbound, sub_http module      | Yes       |
> | From ports, no TLS1.3 for outbound, sub_http module     | No        |
> |                                                         |           |
> | Selfbuild, TLS1.3 for in and outbound, sub_http module  | Yes       |
> | Selfbuild, no TLS1.3 for inbound, sub_http module       | Yes       |
> | Selfbuild, no TLS1.3 for outbound, sub_http module      | No        |
> +---------------------------------------------------------+-----------+
>
> I found a minimal configuration that reliably triggers the issue for a
> standard nginx-1.24.0p0 from packages. You can find it here:
> https://rincewind.home.aperture-labs.org/~tfiebig/malloc/reproduction/
>
> The leak occurs just a few seconds after starting exec.py to send a
> constant request rate of ~10 concurrent requests, i.e., the difference
> in memory consumption becomes visible in two machines that are (apart
> from using TLS1.3 for outbound proxy connections) identical.
>
> The leak seems to occur linearly for the absolute number of requests
> (1k requests ~= 20mb of memory).
>
> I also see a notably higher CPU utilization if TLS1.3 is enabled for
> outbound connections (~3-5x) given the same load. For example, when
> running 100k requests against the test systems, i got (This may be due
> to lacking CPU instructions for algorithms used in TLS1.3, though;
> still figured it might be good to note):
>
> https://rincewind.home.aperture-labs.org/~tfiebig/malloc/cpu_utilization_tls13.png
>
> With the req/s being like this:
>
> Non-leaking hosts:
> #1 o74n1240-self-revp-noprx13.dus01.as59645.net:
>       Got 100000 in 309 seconds (323.62/s)
> #1 o74n1240-pkg-revp-noprx13.dus01.as59645.net:
>       Got 100000 in 310 seconds (322.58/s)
> #1 o74n1240-ports-revp-noprx13.dus01.as59645.net:
>       Got 100000 in 312 seconds (320.51/s)
>
> Leaking hosts:
> #1 o74n1240-self-revp-def.dus01.as59645.net:
>       Got 100000 in 346 seconds (289.02/s)
> #1 o74n1240-ports-revp-nohttp13.dus01.as59645.net:
>       Got 100000 in 348 seconds (287.36/s)
> #1 o74n1240-self-revp-nohttp13.dus01.as59645.net:
>       Got 100000 in 348 seconds (287.36/s)
> #1 o74n1240-ports-revp-def.dus01.as59645.net:
>       Got 100000 in 351 seconds (284.90/s)
> #1 o74n1240-pkg-revp-nohttp13.dus01.as59645.net:
>       Got 100000 in 377 seconds (265.25/s)
> #1 o74n1240-pkg-revp-def.dus01.as59645.net:
>       Got 100000 in 382 seconds (261.78/s)
>
> After this run, the leaking instances were at ~2.9GB, while the non-
> leaking ones were at ~0.8GB active memory.
>
> Do you have any suggestions what else i could test to better identify
> what is causing this? If the config i referenced does not reproduce
> this for you, i can also provide access to these test machines
> (ephemeral boxes; No prod on there. ;-))
>
> With best regards,
> Tobias