Moin,I ran through the experiments i had suggested. As you assumed, this is
indeed related to outbound TLS1.3 connections, specifically:
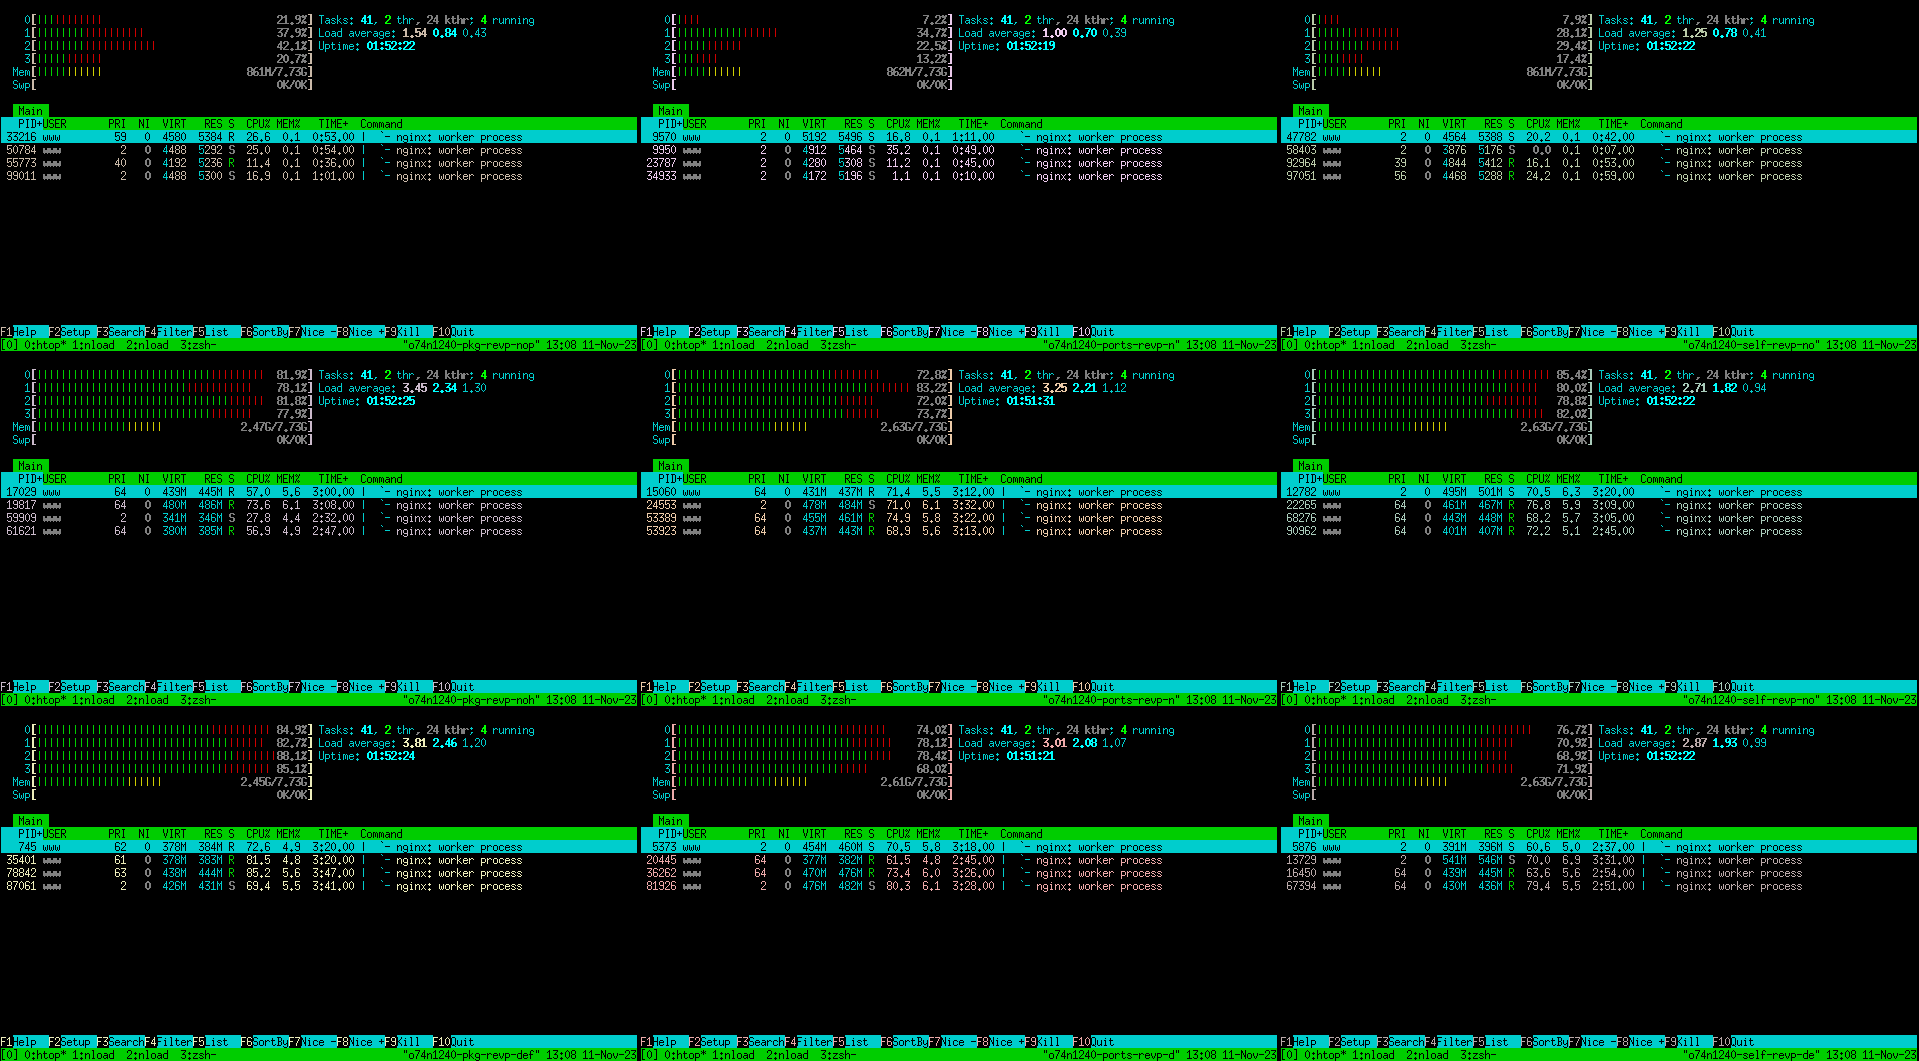
+---------------------------------------------------------------------+
| Config (syspatched OpenBSD 7.4)                         | Memleak?  |
+---------------------------------------------------------+-----------+
| From pkg, TLS1.3 for in and outbound                    | Yes       |
| From pkg, no TLS1.3 for inbound                         | Yes       |
| From pkg, no TLS1.3 for outbound                        | No        |
|                                                         |           |
| From ports, TLS1.3 for in and outbound, sub_http module | Yes       |
| From ports, no TLS1.3 for inbound, sub_http module      | Yes       |
| From ports, no TLS1.3 for outbound, sub_http module     | No        |
|                                                         |           |
| Selfbuild, TLS1.3 for in and outbound, sub_http module  | Yes       |
| Selfbuild, no TLS1.3 for inbound, sub_http module       | Yes       |
| Selfbuild, no TLS1.3 for outbound, sub_http module      | No        |
+---------------------------------------------------------+-----------+

I found a minimal configuration that reliably triggers the issue for a
standard nginx-1.24.0p0 from packages. You can find it here:
https://rincewind.home.aperture-labs.org/~tfiebig/malloc/reproduction/

The leak occurs just a few seconds after starting exec.py to send a
constant request rate of ~10 concurrent requests, i.e., the difference
in memory consumption becomes visible in two machines that are (apart
from using TLS1.3 for outbound proxy connections) identical.

The leak seems to occur linearly for the absolute number of requests
(1k requests ~= 20mb of memory).

I also see a notably higher CPU utilization if TLS1.3 is enabled for
outbound connections (~3-5x) given the same load. For example, when
running 100k requests against the test systems, i got (This may be due
to lacking CPU instructions for algorithms used in TLS1.3, though;
still figured it might be good to note):

https://rincewind.home.aperture-labs.org/~tfiebig/malloc/cpu_utilization_tls13.png

With the req/s being like this:

Non-leaking hosts:
#1 o74n1240-self-revp-noprx13.dus01.as59645.net:
        Got 100000 in 309 seconds (323.62/s)
#1 o74n1240-pkg-revp-noprx13.dus01.as59645.net:
        Got 100000 in 310 seconds (322.58/s)
#1 o74n1240-ports-revp-noprx13.dus01.as59645.net:
        Got 100000 in 312 seconds (320.51/s)

Leaking hosts:
#1 o74n1240-self-revp-def.dus01.as59645.net:
        Got 100000 in 346 seconds (289.02/s)
#1 o74n1240-ports-revp-nohttp13.dus01.as59645.net:
        Got 100000 in 348 seconds (287.36/s)
#1 o74n1240-self-revp-nohttp13.dus01.as59645.net:
        Got 100000 in 348 seconds (287.36/s)
#1 o74n1240-ports-revp-def.dus01.as59645.net:
        Got 100000 in 351 seconds (284.90/s)
#1 o74n1240-pkg-revp-nohttp13.dus01.as59645.net:
        Got 100000 in 377 seconds (265.25/s)
#1 o74n1240-pkg-revp-def.dus01.as59645.net:
        Got 100000 in 382 seconds (261.78/s)

After this run, the leaking instances were at ~2.9GB, while the non-
leaking ones were at ~0.8GB active memory.

Do you have any suggestions what else i could test to better identify
what is causing this? If the config i referenced does not reproduce
this for you, i can also provide access to these test machines
(ephemeral boxes; No prod on there. ;-))

With best regards,
Tobias