Hi John,

Thanks for the info.
I don't think Geoff is properly adjusting for ARIN's team review rate, which
is around 200 per month.
Reading between the lines, I think this is about ARIN's max carrying rate
without schedule slippage.
Considering the nature of the remaining pool dregs, ARIN will be needing to
do around 1200 team reviews of the /23 and /24s which will remain in
inventory near the end.
Also we know that most allocation requests are for much larger blocks, thus
we know that applicants will go away for at least three months between their
meager allocations.
This applies a braking action.
So as I see it, there is at least six months AFTER all the larger blocks go
away before we are empty.
The projected date of the ides of March is too early, as it is less than six
months from now.
The projection difficulties that result from the disparate nature of
allocation sizes diminishes as we reach the dregs.
Regards,
Mike
-----Original Message-----
From: John Curran
Sent: Tuesday, September 30, 2014 11:23 AM
To: Matthew Kaufman
Cc: [email protected] List
Subject: Re: [arin-ppml] Queue depth report?

On Sep 30, 2014, at 10:45 AM, Matthew Kaufman <[email protected]> wrote:
I've been watching Geoff's ARIN runout prediction slip out into the
future, and reading here about increased review leading to slower
processing... Is runout being delayed just because legitimate applications
for space are queuing up?
Can we get a report on historical and current application queue depth from
staff?
Matthew -
Queue lengths for IPv4 assignment and allocations did lengthen slightly
when we instituted team review (per Phase 1 of the countdown plan which
was reached in April), but they've been steady since and are not what is
driving Geoff's runout numbers to slip...
Geoff's outlook is based on recent allocation history (he does a least
squares linear best fit on this data), which means that his estimate
will move up after a very large allocation (such as was made in this
past April) and then will begin to slide out if the following months
do not maintain that predicted higher allocation rate.
The second graph on this page shows the monthly allocation from the
free pool in terms of /24 equivalents; the April allocation is rather
pronounced - <https://www.arin.net/knowledge/statistics/index.html>
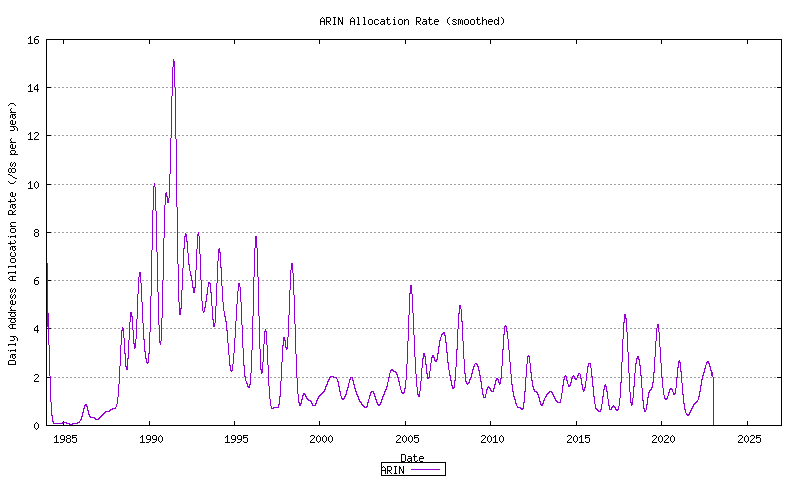
Geoff's best fit for ARIN Address Allocation Rate can be seen in the
graph here - <http://www.potaroo.net/tools/ipv4/fig27i.png> Note how
it spiked after that allocation, but has been slowing down since...
(it's a little hard to read because of the 5 year scale, but the
newest non-zero data on the far right side is the important part.)
If we should make another large assignment or allocation, then Geoff's
estimates will pull in according; Geoff has noted on several occasions
that towards the end of the free pool, it becomes fairly difficult to
have a reliable prediction since it becomes more about the timing of a
rather small number of discrete events (e.g. the very large allocations)
than the calculated run rate.
If you need anything additional, please let me know... (Also, I've cc'd
the esteemed Geoff Huston on this email; it's only fair in any lengthly
discussion of his great efforts. :-) )
Thanks!
/John
John Curran
President and CEO
ARIN
_______________________________________________
PPML
You are receiving this message because you are subscribed to
the ARIN Public Policy Mailing List ([email protected]).
Unsubscribe or manage your mailing list subscription at:
http://lists.arin.net/mailman/listinfo/arin-ppml
Please contact [email protected] if you experience any issues.