Hi

This make me think about something i have found when i started to go deep in
the Tapestry page pool code. It's about the PagePoolImpl service. If we look
at the checkout method, we can see that the test made to check the pool's
limits is made on a inUse list. I have made the experience that in heavy
load when the pool is empty this test becomes useless because the inUse list
is updated after the page loading (that is obviously not synchronized).
Theory is that if you have huge page, you may come into this case.
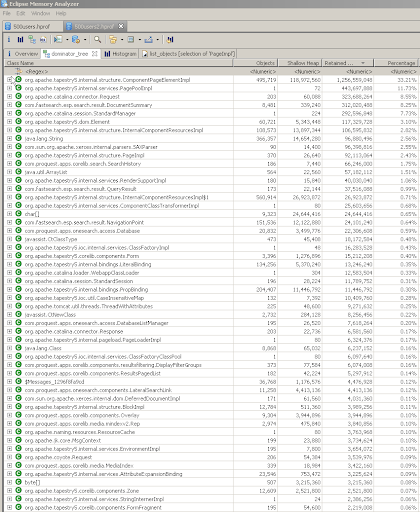
I don't know if it's related to your problem, but I guess, this is why
"tapestry.page-pool.hard-limit" will be deprecated, as this is to the
container to handle the limits of request handling threads.

Anyway, in the meantime shouldn't we handle the limits check using a
'inConstruction' list ? But it sounds to simple to be true :)


2010/6/29 Blower, Andy <andy.blo...@proquest.co.uk>

> I doubt anyone remembers this thread except me, but we're still having
> problems that I could do with help on.
>
> So, two months later, we have managed to improve things significantly, but
> still have very large pages and we're having a lot of trouble with the page
> pool size. What we see when we push the app too hard is that the heap fills
> until the gc thread is permanently running, and the app is essentially dead
> and unresponsive. I've been testing with 2g & 4g heaps up to now, with 100ms
> soft-wait & 200 hard limit because we need a lot of instances of some pages,
> and were running out with a 100 limit. I know I need to understand and do
> more with these values, but it's worrying because our tests are only
> requesting English pages at present and we'll have 17 languages for launch!
> So I'm rather concerned to say the least...
>
> I have a theory about what is happening that I'd like to run by the list
> and see what others think. I'm having some trouble figuring out what's
> happening at load.
>
> What I think is that when the heap gets full-ish at high load, the gc kicks
> in more and more often, slowing request processing down a little. (there's a
> fair amount of soft referenced stuff it can boot) This means that pages are
> returned to the page pool a bit later causing more page instances to be
> created which fills the heap and enters an vicious cycle with the gc trying
> to free memory and the T5 page pool trying to create more page instances.
> The reason I suspect this is because heap dumps show about 40 PageImpl's
> that have not completed loading, and many more that have but are much
> smaller in size than others for the same page. (e.g. a Results PageImpl
> retaining 28k when a normal one retains 7.5Mb - very big I know, but I've
> cut it down from 14Mb)
>
> Our site has 223 pages which consume 213Mb if 1 instance of each is
> instantiated. Multiply this by 200 (hard limit) and then by 17 languages and
> worst case we'll need a heap size of 725Gb which is a little ridiculous! I
> will do more work on reducing the size of the pages but I've already done
> the easy stuff.
>
> Here's a list of the heap dominators using Eclipse MAT,
> http://lh6.ggpht.com/_YwJn8TJTqJU/TCoNT11ouZI/AAAAAAAAACI/G8eTGsth4zM/HeapDominators.png
>
> Anyone think I'm on the right track, or barking up the wrong tree
> completely?
>
> Thanks,
>
> Andy
>
> > -----Original Message-----
> > From: Blower, Andy [mailto:andy.blo...@proquest.co.uk]
> > Sent: 20 April 2010 17:42
> > To: 'Tapestry users'
> > Subject: RE: Tapestry using 1.3Gb of heap space after capacity testing
> >
> > Thanks for the link. As I said before, I don't think that we've fallen
> > prey to that exactly. Doing some local testing and looking at one of
> > our largest pages which displays search results, it has 76 component
> > objects, each of those will have components nested within (pretty
> > heavily in some cases) but nothing which has a bunch of components
> > where only one is used and the others are redundant. (what I think is
> > this uber-component thing)
> >
> > It looks like explicit repeated use of a component, rather than using a
> > single component in a loop, creates a lot more component objects in the
> > heap. I've never seen anything warning against this, and we do usually
> > use loops but it's not always the best solution.
> >
> > Again, looking at our results page, a single instance seems to get
> > 11,283 ComponentPageElementImpl instances created for it. I'm finding
> > it hard to find a good view of the tree to figure out what component(s)
> > are the main culprits for this huge number of instances.
> >
> > Thanks for any help or guidance you can give me.
> >
> > Andy
> >
> > > -----Original Message-----
> > > From: Thiago H. de Paula Figueiredo [mailto:thiag...@gmail.com]
> > > Sent: 20 April 2010 15:56
> > > To: Tapestry users
> > > Subject: Re: Tapestry using 1.3Gb of heap space after capacity
> > testing
> > >
> > > On Tue, 20 Apr 2010 11:41:25 -0300, Blower, Andy
> > > <andy.blo...@proquest.co.uk> wrote:
> > >
> > > > Uber-component anti-pattern, not to my knowledge, but we have a lot
> > > of
> > > > pages and components now. And a lot of logic in them. The project's
> > > > large enough I can't be sure. Do you have a handy link to Howard's
> > > > description so I can get my team to check?
> > >
> > > It's here:
> > > http://old.nabble.com/-T5.0.18--Out-of-Memory-Error---Potential-Leak-
> > > (doesn't-reduce-after-forced-GC)-to25403474s302.html#a25497441
> > > That thread is interesting, by the way. The problem is more about how
> > > components and pages are written than the number of them.
> > > What Tapestry version are you using?
> > >
> > > > Page pool config is default, I don't know enough to fiddle yet.
> > Also,
> > > > the test is on a single stand alone server with no clustering, we
> > are
> > > > using Tomcat clustering for production.
> > >
> > > You should take a look a them, as they can affect the memory
> > > consumption
> > > directly.
> > >
> > > > I did fire the GC manually before getting concerned BTW. A lot of
> > > heap
> > > > seems to be taken up with 100-300k descriptions on the
> > > > InternalClassTransformationImpl class. An example of one is
> > attached
> > > > below - seems wrong to me and more like the debug that can be
> > > requested
> > > > through log4j rather than a description.
> > >
> > > They look really bigger than they should. 300k is a lot. I have one
> > > application with a reasonable number of pages and components and it
> > > runs
> > > inside a 512 MB slide at SliceHost without using the whole memory.
> > >
> > > --
> > > Thiago H. de Paula Figueiredo
> > > Independent Java, Apache Tapestry 5 and Hibernate consultant,
> > > developer,
> > > and instructor
> > > Owner, software architect and developer, Ars Machina Tecnologia da
> > > Informação Ltda.
> > > http://www.arsmachina.com.br
> > >
> > > ---------------------------------------------------------------------
> > > To unsubscribe, e-mail: users-unsubscr...@tapestry.apache.org
> > > For additional commands, e-mail: users-h...@tapestry.apache.org
> > >
>
>


--
Regards,
Christophe Cordenier.

Committer on Apache Tapestry 5
Co-creator of wooki @wookicentral.com