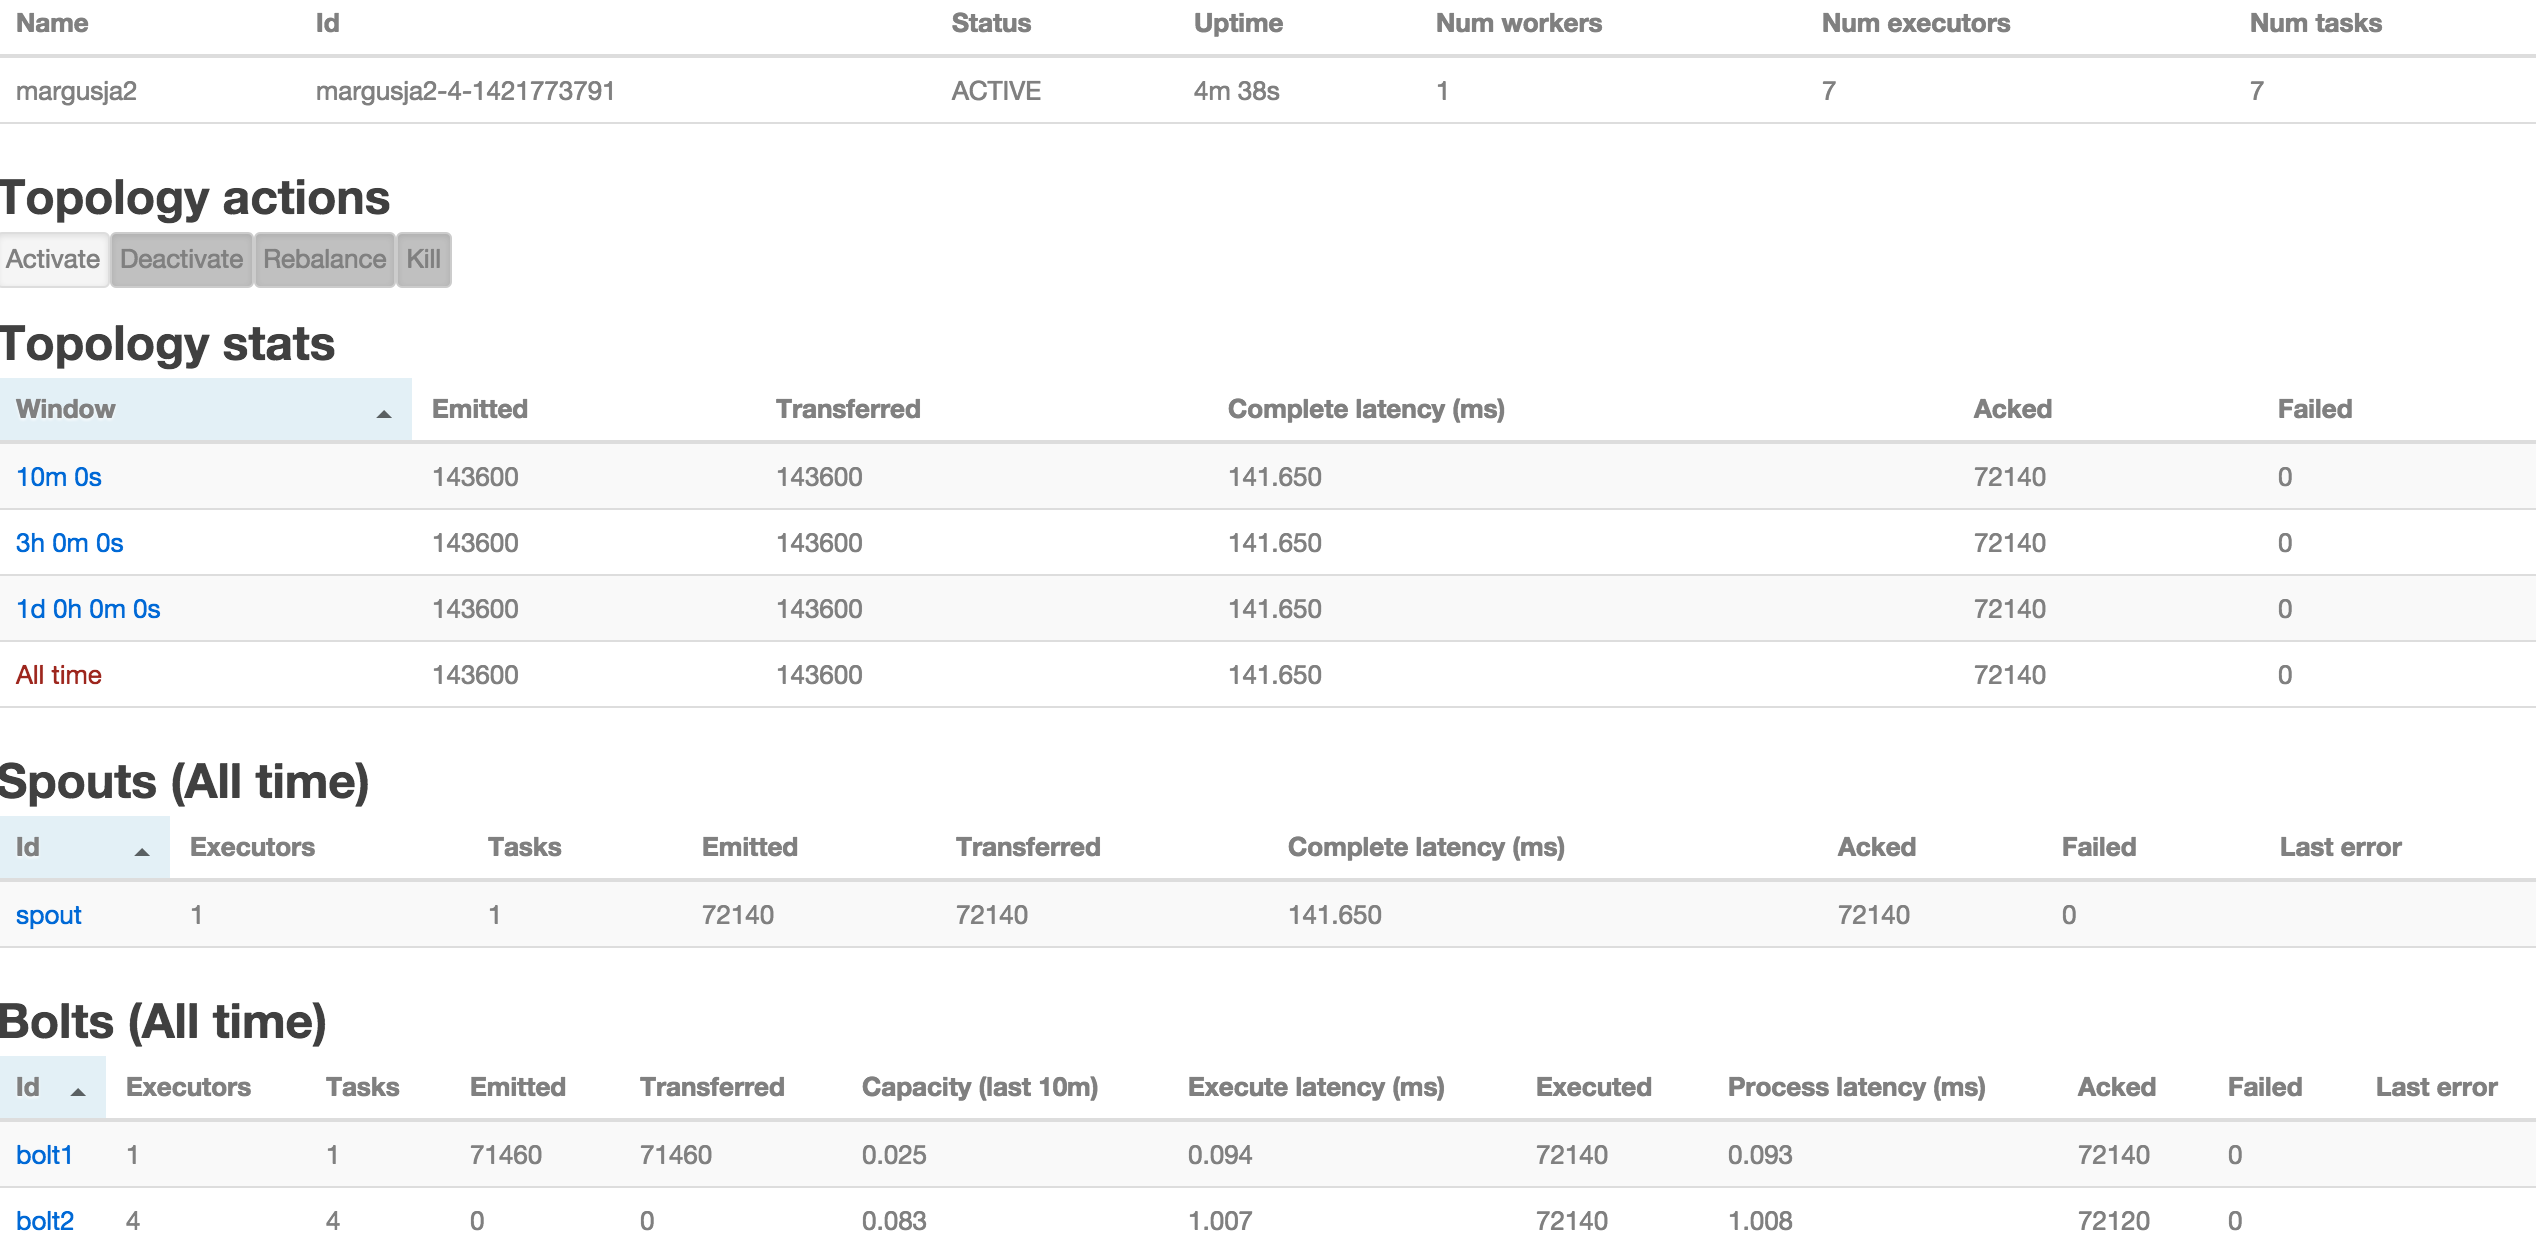
when I start topology then it looks nice - after 10m running
http://margus.roo.ee/wp-content/uploads/2015/01/Screenshot-2015-01-20-19.15.00.png
Margus (margusja) Roo
http://margus.roo.ee
skype: margusja
+372 51 480

On 20/01/15 19:04, Margus Roo wrote:
Hi
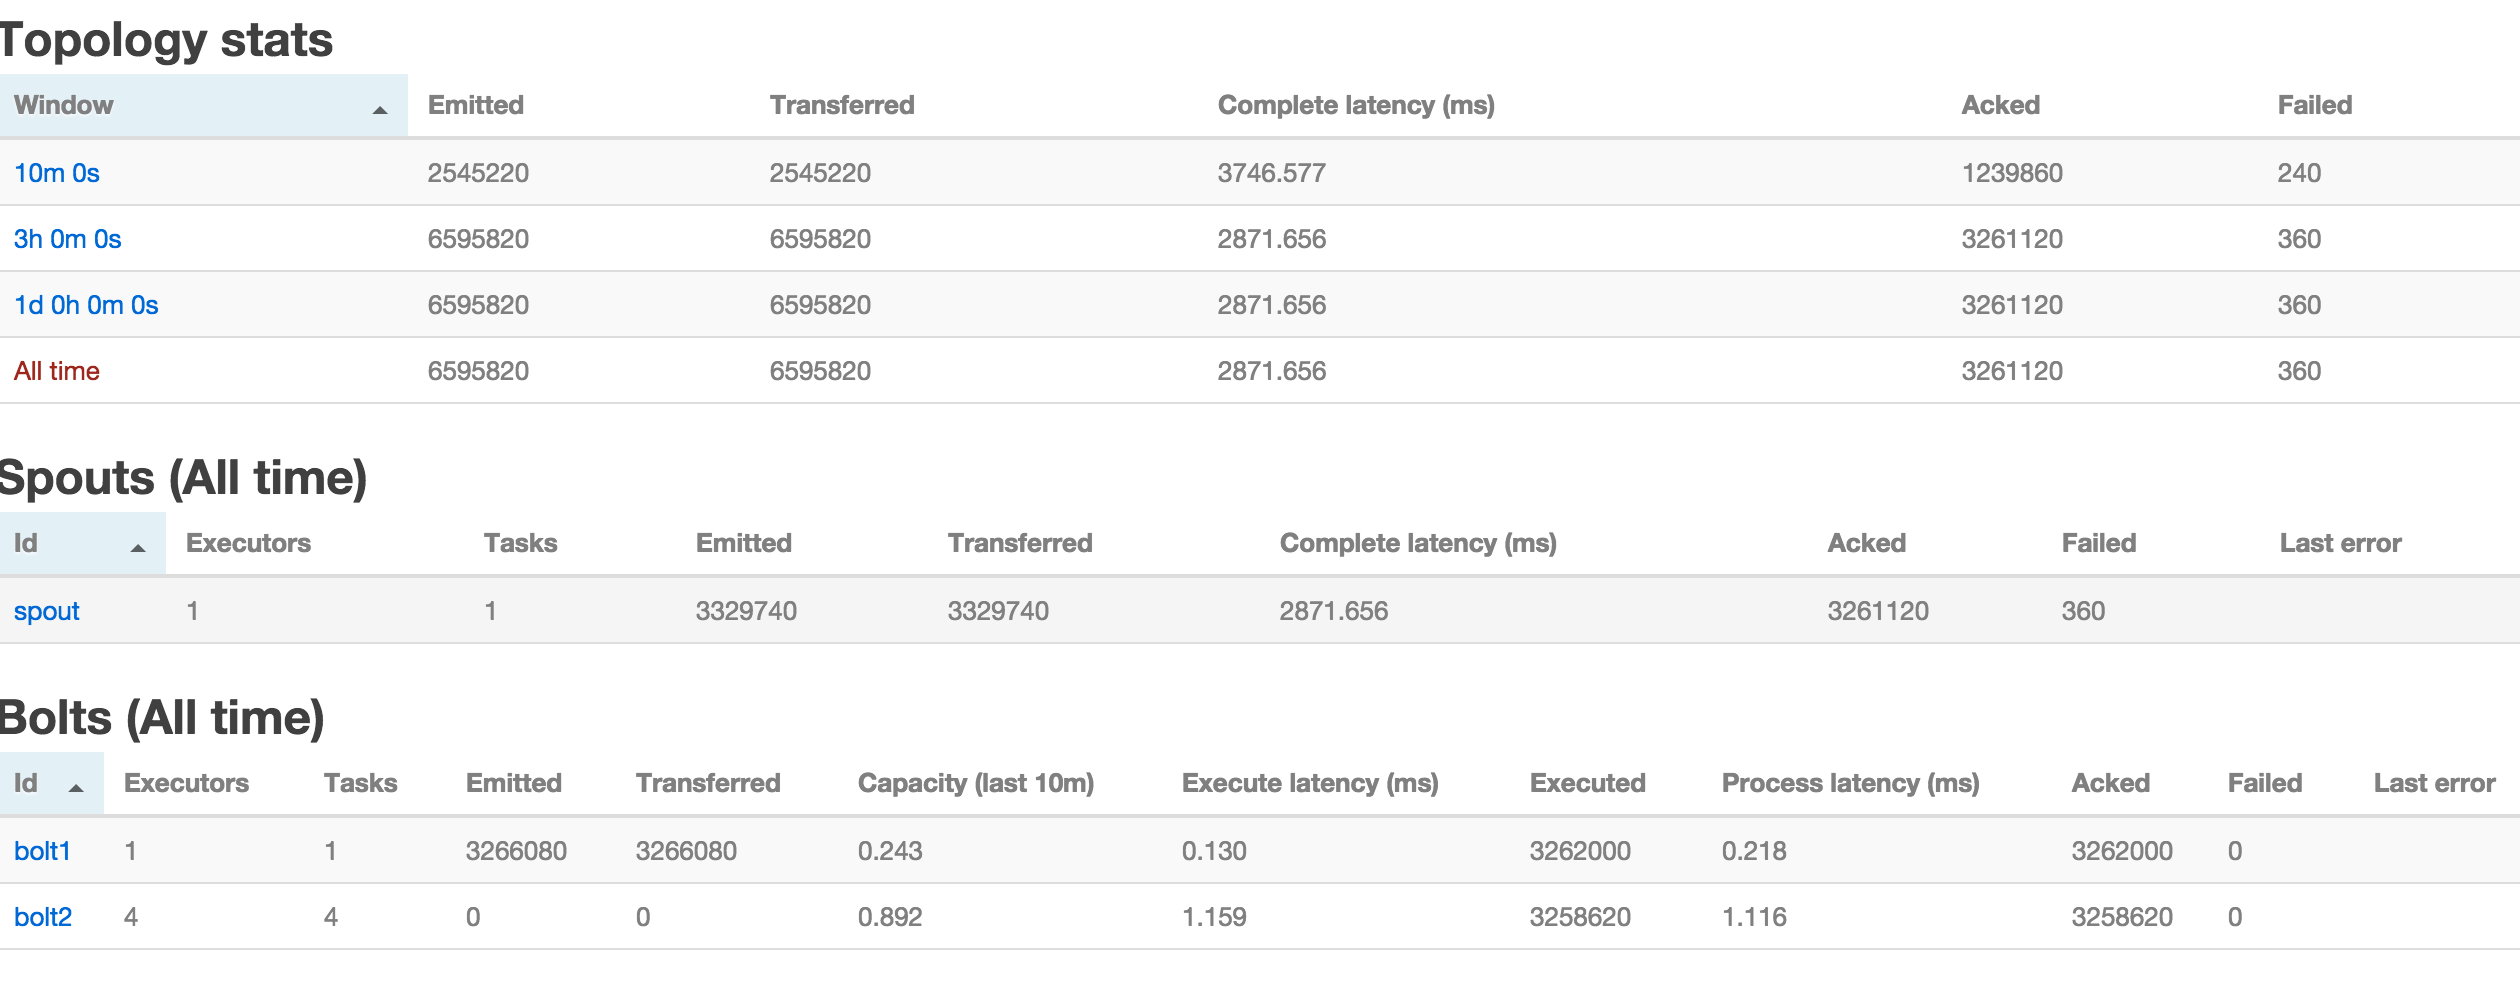
Here we can see that there are some failed messages behind spout. And
Capacity behind bolt2 is near to 1.
http://margus.roo.ee/wp-content/uploads/2015/01/Screenshot-2015-01-20-18.54.08.png
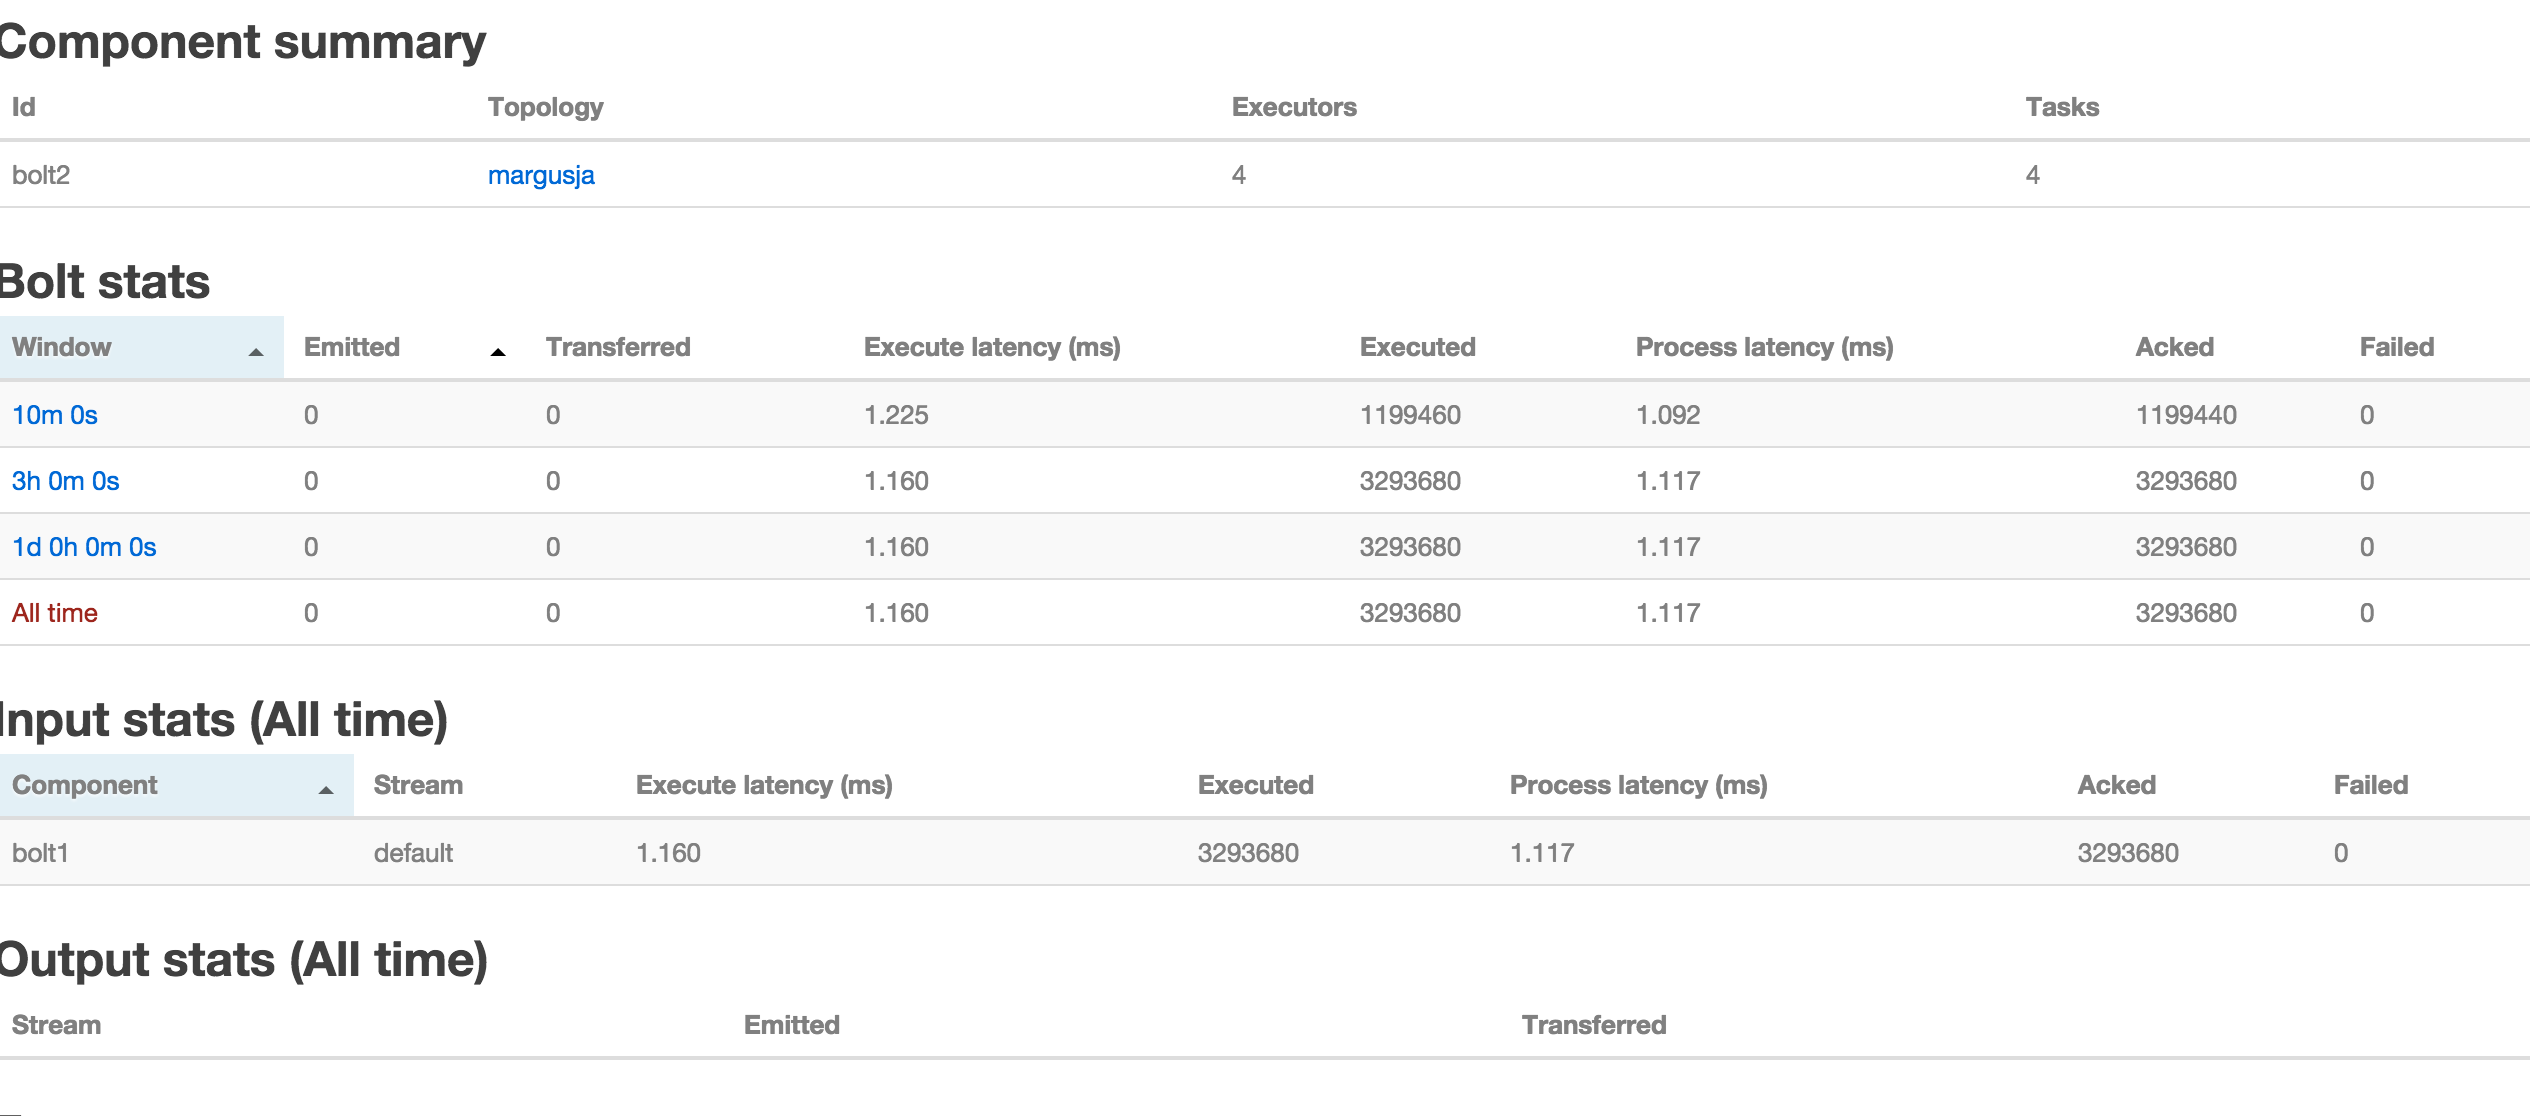
there are four task are writing messages to hbase.
http://margus.roo.ee/wp-content/uploads/2015/01/Screenshot-2015-01-20-18.54.31.png
Another question. In the first picture I can see quite big number
under Complete latency behind Spout.
But numbers behind bolts are quite small. Where that complete latency
comes from?
Margus (margusja) Roo
http://margus.roo.ee
skype: margusja
+372 51 480
On 20/01/15 01:06, Kosala Dissanayake wrote:
Hi Margus,
See which bolts have high 'Capacity' values in the Storm UI, and
whether any of those are close to / above 1 to get a clue about where
the bottleneck might be.
On Tue, Jan 20, 2015 at 3:38 AM, Margus Roo <[email protected]
<mailto:[email protected]>> wrote:
    Hi

    I have simple topology Kafka consumer (Spout) and HBase writer (bolt)

    Sometimes some messages getting failed status. Most of time
    topology works well but I'd like to know what is exact reason why
    message fails. As much I have read there is timeout (default 30s)
    when message fails. But this is not enough. I need to know where
    is bottleneck to improve.
    Timeouts appears behind spout. As much I understand Spout gets
    ack in case message is fully processed by topology.
    So the question is where to dig ?
--
Margus (margusja) Roo
    http://margus.roo.ee
    skype: margusja
    +372 51 480