I thought PrintFLSStatistics was necessary for determining heap
fragmentation? Or is it possible to see that without it as well?
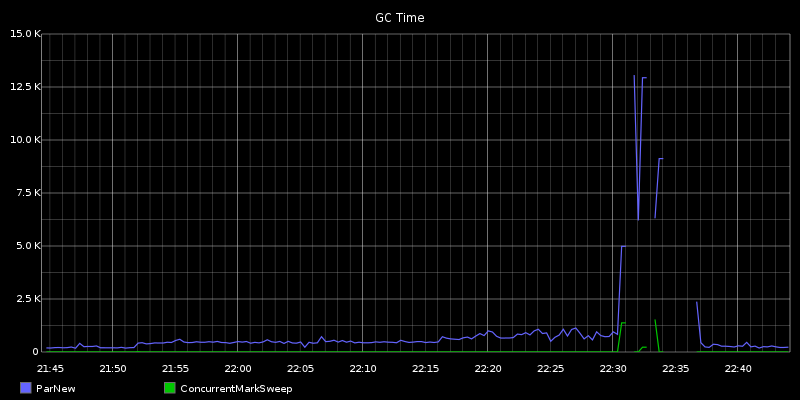
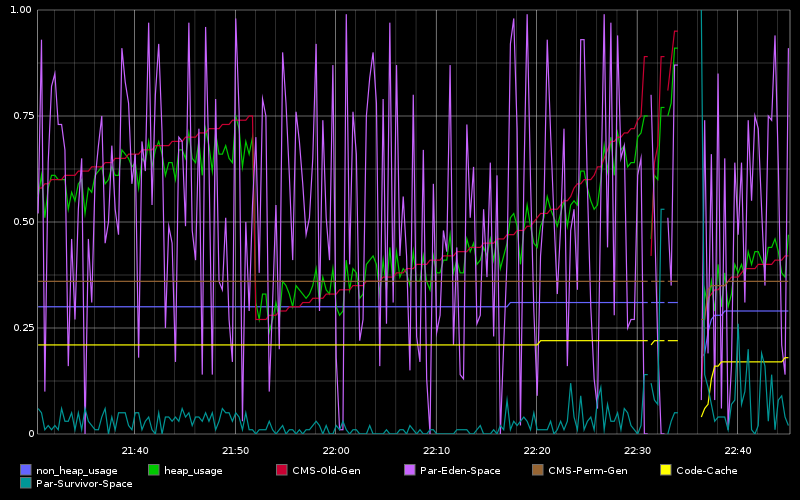
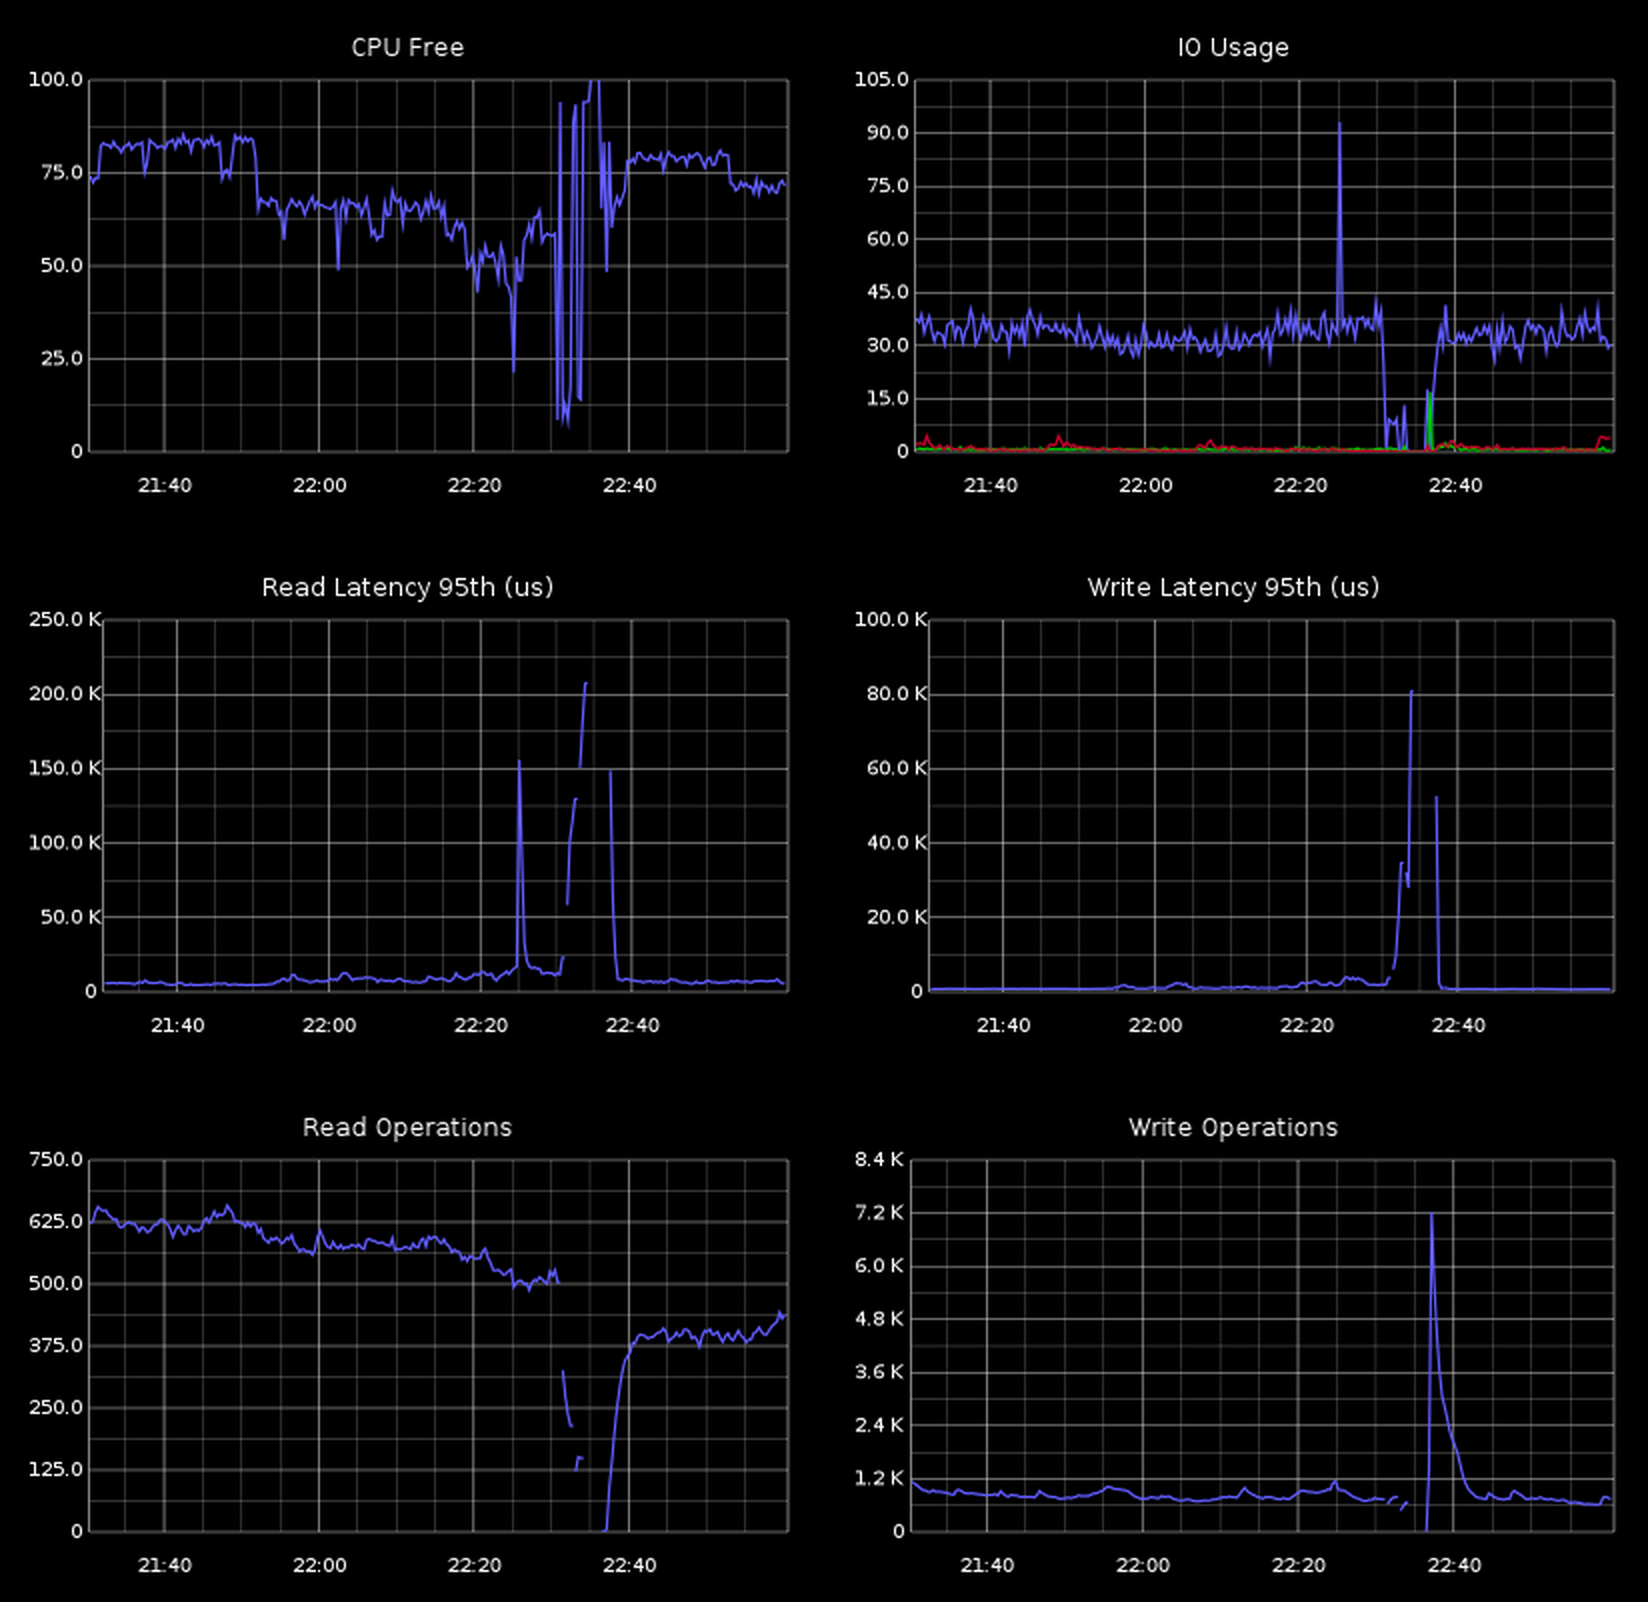
Perm-Gen stays steady, but I'll enable it anyway to see if it has any affect.

Thanks,

John

On Wed, Jan 22, 2014 at 8:34 AM, Lee Mighdoll <[email protected]> wrote:
> I don't recommend PrintFLSStatistics=1, it makes the gc logs hard to
> mechanically parse.  Because of that, I can't easily tell whether you're in
> the same situation we found.  But just in case, try setting
> +CMSClassUnloadingEnabled.  There's an issue related to JMX in DSE that
> prevents effective old gen collection in some cases.  The flag's low
> overhead, and very effective if that's your problem too.
>
> Cheers,
> Lee
>
>
> On Tue, Jan 21, 2014 at 12:02 AM, John Watson <[email protected]> wrote:
>>
>> Pretty reliable, at some point, nodes will have super long GCs.
>> Followed by https://issues.apache.org/jira/browse/CASSANDRA-6592
>>
>> Lovely log messages:
>>
>>   9030.798: [ParNew (0: promotion failure size = 4194306)  (2:
>> promotion failure size = 4194306)  (4: promotion failure size =
>> 4194306)  (promotion failed)
>>   Total time for which application threads were stopped: 23.2659990
>> seconds
>>
>> Full gc.log until just before restarting the node (see another 32s GC
>> near the end): https://gist.github.com/dctrwatson/f04896c215fa2418b1d9
>>
>> Here's graph of GC time, where we can see a an increase 30 minutes
>> prior (indicator that the issue will happen soon):
>> http://dl.dropboxusercontent.com/s/q4dr7dle023w9ih/render.png
>>
>> Graph of various Heap usage:
>> http://dl.dropboxusercontent.com/s/e8kd8go25ihbmkl/download.png
>>
>> Running compactions in the same time frame:
>> http://dl.dropboxusercontent.com/s/li9tggk4r2l3u4b/render%20(1).png
>>
>> CPU, IO, ops and latencies:
>>
>> https://dl.dropboxusercontent.com/s/yh9osm9urplikb7/2014-01-20%20at%2011.46%20PM%202x.png
>>
>> cfhistograms/cfstats:
>> https://gist.github.com/dctrwatson/9a08b38d0258ae434b15
>>
>> Cassandra 1.2.13
>> Oracle JDK 1.6u45
>>
>> JVM opts:
>>
>> MAX_HEAP_SIZE="8G"
>> HEAP_NEW_SIZE="1536M"
>>
>> Tried HEAP_NEW_SIZE of 768M, 800M, 1000M and 1600M
>> Tried default "-XX:SurvivorRatio=8" and "-XX:SurvivorRatio=4"
>> Tried default "-XX:MaxTenuringThreshold=1" and
>> "-XX:MaxTenuringThreshold=2"
>>
>> All still eventually ran into long GC.
>>
>> Hardware for all 3 nodes:
>>
>> (2) E5520 @ 2.27Ghz (8 cores w/ HT) ["16" cores]
>> (6) 4GB RAM [24G RAM]
>> (1) 500GB 7.2k for commitlog
>> (2) 400G SSD for data (configured as separate data directories)
>
>