<<On Thu, 11 Sep 2025 18:32:17 -0700, Rick Macklem <rick.mack...@gmail.com>
said:
> One simple thing you could do that might provide some insight
> into what is going on is..
> - do "nfsstat -s" in a loop (once/sec) along with "date" written out
>   to some log file on the server.
>   - Then when the problem shows up, look at the log file and see what
>     RPCs/operations load the server was experiencing.
>     (read vs write vs lookup vs ???)

We monitor NFS ops with munin, same as everything else, every five
minutes.  The more detailed data has already rolled off the RRDs, but
in the half-hour before the OOM event, write ops spiked to a (still
quite tame) 5,000 per second.  That's well below observed peaks in
writes over every averaging interval.[1]  (The other NFS ops that you'd
expect to see for a v4 client doing lots of writes increased as well,
about one open/close pair per four write ops.)  So I don't think it's
anything NFS is doing on its own, but might be something ZFS is doing
badly when the writes hit.

The server continued to operate, with various other daemons getting
shot as the OOM killer rampaged, until the on-call person got alerted
by our monitoring.  Never less than 105G physmem free in the 12 hours
leading up to the event.  It took about 36 hours after a hard reboot
for the system to get back to the same level of free RAM and to start
swapping out idle daemons.

<https://bimajority.org/%7Ewollman/memory-pinpoint%3D1756957462%2C1757648662.png>
shows the memory utilization over the course of the past week
including the incident on Tuesday morning.  I don't know why there's
25G of inactive pages for three days leading up to the OOM; perhaps
that's related?  Inactive is normally much less than 1G.

One thing that was going on when the crash happened is that we were
demoing the Bacula Enterprise client on one large filesystem, using
their new support for using `zfs diff` to speed up incrementals, and
it was taking an unexpectedly long time.  No idea at this point
whether that might be a cause or a symptom.

-GAWollman

[1] We've had some days when the *24-hour* average write op rate has
been over 30,000 per second, although I can't say whether that
happened under 13.3, 13.4, or 14.3, all of which we've run on this
server in the past 12 months.
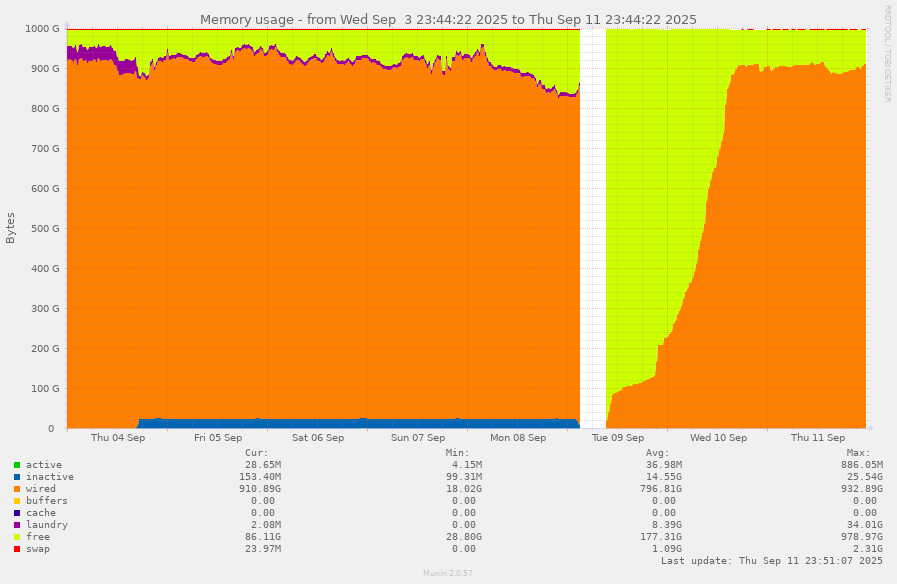