Hi,

I'm looking for a little inspiration and experience here.
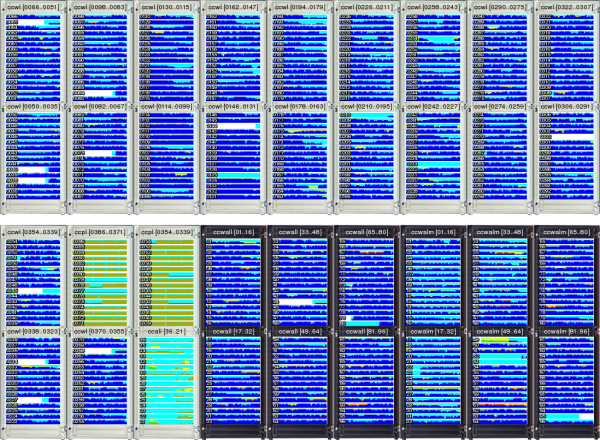
We have a customer that has about 400 interfaces and he'd like to get an
overview of "How these interfaces are doing". When there are more than
about 15-20, looking at each individual graph simply brakes down.

My user wants an idea of what the "normal" situation is, and information
about the worst outliers / extreme cases.

Looking at average and standard deviation is a possibility, but most of my
users (and I) really have no good intuitive feeling for what standard
deviation really "means". Plus "outlier/extreme" information is lost.

I've seen that smokeping does something interesting, see e.g.

http://oss.oetiker.ch/smokeping-demo/img/Customers/OP/james~octopus_last_10800.png

The "historgram" approach where darker grey implies more datapoints in this
"region" could be cool. This gives the overview. Have no idea how this is
accomplished, though.

I was thinking of using a "histogram" approach like above overlayed with
showing the actual graphs of the N worst outliers/extremes. But that
implies lots of scripting and analysis to create the histogram (I'm
guessing) and to identify the outliers.

So: What have you guys done when creating an overview of many statistics?
I'll leave you with this picture from the gallery:

http://oss.oetiker.ch/rrdtool/gallery/576_nodes.png

This is exactly the situation I want to avoid....

Sincerely,

Peter

--
Peter Valdemar Mørch
http://www.morch.com
_______________________________________________
rrd-users mailing list
rrd-users@lists.oetiker.ch
https://lists.oetiker.ch/cgi-bin/listinfo/rrd-users