OK - I've been doing some work on getting a forest plot or two together for a
sub-group analaysis.  Thats the crucial thing - because its a sub-group
analysis rather than a meta-analsysis and all the forest (meta) and forestplot
(rmeta) instructions assume you are doing a meta-analysis.
I found rmeta didn't play nicely for me so I'm using the meta package with
forest. Here's some code that would allow you to reproduce it:
library(meta)
mydata.forest.DoseRed = data.frame(c(1,7,14,6,16), c(7,21,10,15,23),
c(1,1,5,2,5), c(4,7,6,5,12))
colnames(mydata.forest.DoseRed)=c("n.DR","n.No.DR", "E.DR","E.No.DR")
rownames(mydata.forest.DoseRed)=c( "Age: 50-59", "Age: 60-69 ", "Age: >70",
"Sex: F ", "Sex: M")
mydata.meta.DoseRed = metabin(
E.DR, n.DR, E.No.DR, n.No.DR,
data=mydata.forest.DoseRed,
sm="RR", meth="MH",
studlab=rownames(mydata.forest.DoseRed)
)
forest(
mydata.meta.DoseRed,
comb.fixed=TRUE,
comb.random=FALSE,
leftcols="studlab",
plotwidth=unit(8, "cm"),
at = c(0.5,1.0,2.0,3.5),
xlim = c(0.22, 3.48)
)
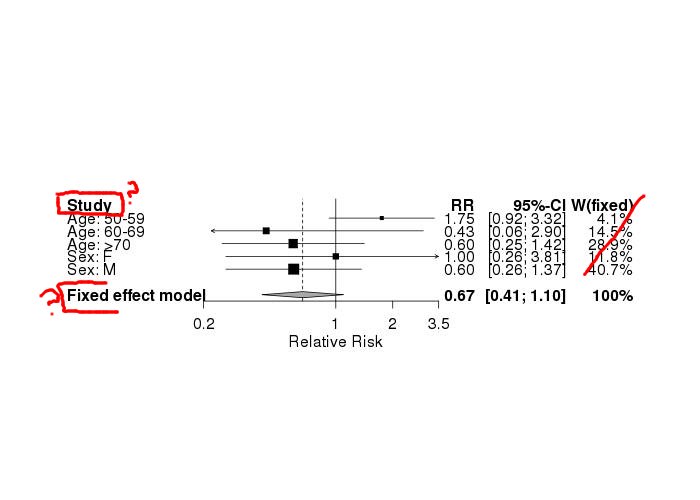
Thats roughly what I want. There is a jpeg of it here:
http://www.wittongilbert.free-online.co.uk/forest.jpg
BUT - there are two problems:
Firstly the subgroups have a heading called Study - which makes sense for a
meta-analysis but should say something like sub-groups for a sub-group
analysis. Anyone know if this is customisable?
Secondly I want to display a global effect (i.e. the RR and confidence
intervals for the whole study population) - thats what the diamond should show
but it actually is the MH Fixed Effect Model. Again - probably appropriate for
a meta-analysis but I know the actual value for the whole population so i don't
have to model it... Anyone know how to get that top plot instead? forest
doesn't open a standard plot window so you can't simply use plot commands to
send extra stuff to the window.
Or do I need to use plot (mydata.meta.DoseRed) and then build up the extra info
from there? Still surprised this isn't a proper function!
********************************************************************************************************************
This message may contain confidential information. If yo...{{dropped:21}}
______________________________________________
R-help@r-project.org mailing list
https://stat.ethz.ch/mailman/listinfo/r-help
PLEASE do read the posting guide http://www.R-project.org/posting-guide.html
and provide commented, minimal, self-contained, reproducible code.