Daer R, usersI want to get a point data from netcdf file using the longitude
and latitude,
but have no luck with the code I'm using. Here is the code. Please help!
rm( list = ls() )                                               # Clearing the
workspace
setwd( "/run/media/tuju/0767090047/extract_wrf_txt_file" )
library( ncdf4 )                                       # Loading the ncdf4
package to read the netcdf data
library(ncdf)
inp_file <- open.ncdf( "wrfout_d01_2015-12-30.nc" )      # Reading the netcdf
data
time <- get.var.ncdf( inp_file, "Times" )                 # Extracting the
forecasts time

sites <- read.csv("Station_Coordinates_TMA.csv", sep = "\t")
attach(sites)

source( "whereis.R" )
lat = get.var.ncdf(inp_file, "XLAT")
lon = get.var.ncdf(inp_file, "XLONG")

lower_left_lon_lat = c( 22, -16 )
upper_right_lon_lat = c( 56, 7 )

ix0 = wherenearest( lower_left_lon_lat[1],  lon )
ix1 = wherenearest( upper_right_lon_lat[1], lon )
iy0 = wherenearest( lower_left_lon_lat[2],  lat )
iy1 = wherenearest( upper_right_lon_lat[2], lat )

countx = ix1 - ix0 + 1
county = iy1 - iy0 + 1

rainc = get.var.ncdf( inp_file, "RAINC", start = c( ix0, iy0, 1 ), count = c(
countx, county, 1 ))
 _____________
Peter  E. Tuju
Dar es Salaam
T A N Z A N I A
----------------------


      From: "r-help-requ...@r-project.org" <r-help-requ...@r-project.org>
 To: r-help@r-project.org
 Sent: Friday, January 15, 2016 2:00 PM
 Subject: R-help Digest, Vol 155, Issue 15

Send R-help mailing list submissions to
    r-help@r-project.org

To subscribe or unsubscribe via the World Wide Web, visit
    https://stat.ethz.ch/mailman/listinfo/r-help
or, via email, send a message with subject or body 'help' to
    r-help-requ...@r-project.org

You can reach the person managing the list at
    r-help-ow...@r-project.org

When replying, please edit your Subject line so it is more specific
than "Re: Contents of R-help digest..."


Today's Topics:

  1. Re: printing a data.frame that contains a list-column of S4
      objects (boB Rudis)
  2. Overlapping subject-specific histograms (Frank S.)
  3. Re: Overlapping subject-specific histograms (PIKAL Petr)
  4. unexpected behaviour of an extended time series (using
      packages    spuRs and xts) (Olivier ETERRADOSSI)
  5. Re: Overlapping subject-specific histograms (Frank S.)
  6. zyp Vs. kendall package for Time Series Trend (Morteza Firouzi)
  7. read.xlsx - write.xlsx: reading/writing numbers as character
      (Mohsen Jafarikia)
  8. parameter constraints in glm() and Bayesian version
      (mara.pfleide...@uni-ulm.de)
  9. R: layout() affects margin size in subfigures [unexpected
      behaviour] (Malcolm Perry)
  10. Re: read.xlsx - write.xlsx: reading/writing numbers as
      character (jim holtman)
  11. Re: read.xlsx - write.xlsx: reading/writing numbers as
      character (Mohsen Jafarikia)
  12. Re: R: layout() affects margin size in subfigures [unexpected
      behaviour] (Sarah Goslee)
  13. Re: read.xlsx - write.xlsx: reading/writing numbers as
      character (Jim Holtman)
  14. Re: Problems with data structure when using plsr() from
      package    pls (David Winsemius)
  15. Re: read.xlsx - write.xlsx: reading/writing numbers as
      character (Mohsen Jafarikia)
  16. Re: read.xlsx - write.xlsx: reading/writing numbers as
      character (Mohsen Jafarikia)
  17. Re: read.xlsx - write.xlsx: reading/writing numbers as
      character (jim holtman)
  18. Updating a Time Series After Forecast() (Lorenzo Isella)
  19. Tukey and extracting letters in multcomp (Lauren Moscoe)
  20. Problem with rJava (AASHISH JAIN)
  21. Re: Problem with rJava (ProfJCNash)
  22. Multiplication of high dimensional array (guoxiong)
  23. How can we let "multiplot.R" return a plot? (jpm miao)
  24. Re: How can we let "multiplot.R" return a plot? (David Winsemius)
  25. Re: How can we let "multiplot.R" return a plot? (Jim Lemon)
  26. R 3.2.3 on Windows 8.1 with interface scaling: how do I
      produce metafiles that fill the whole canvas? (Peter Crowther)


----------------------------------------------------------------------

Message: 1
Date: Thu, 14 Jan 2016 06:26:34 -0500
From: boB Rudis <b...@rudis.net>
To: Martin Maechler <maech...@stat.math.ethz.ch>
Cc: r-help mailing list <r-help@r-project.org>, Jenny Bryan
    <je...@stat.ubc.ca>
Subject: Re: [R] printing a data.frame that contains a list-column of
    S4    objects
Message-ID:
    <CAJ4QxaMBDbmpPeBz2Wsy4dgpe4ejT8=7gsoxr+aq79njfd3...@mail.gmail.com>
Content-Type: text/plain; charset=UTF-8

Martin, I'm pretty sure the use of Matrix here (actually by someone
else than Dr Bryan) was to make an easy, inline, reproducible example.
The actual "ugh" column comes from using git2r. I'm assuming there's
an API call returning some pretty gnarly structures that are getting
shoehorned into a data.frame. That happens more often than I'd like in
modern API calls (really complex/nested JSON being returned).

On Thu, Jan 14, 2016 at 3:34 AM, Martin Maechler
<maech...@stat.math.ethz.ch> wrote:
>>>>>> boB Rudis <b...@rudis.net>
>>>>>>    on Tue, 12 Jan 2016 13:51:50 -0500 writes:
>
>    > I wonder if something like:
>    > format.list <- function(x, ...) {
>    > rep(class(x[[1]]), length(x))
>    > }
>
>    > would be sufficient? (prbly needs more 'if's though)
>
> Dear Jenny,
> for a different perspective (and a lot of musings), see inline below
>
>    > On Tue, Jan 12, 2016 at 12:15 PM, Jenny Bryan <je...@stat.ubc.ca> wrote:
>    >> Is there a general problem with printing a data.frame when it has a
>    >> list-column of S4 objects? Or am I just unlucky in my life choices?
>    >>
>    >> I ran across this with objects from the git2r package but maintainer
>    >> Stefan Widgren points out this example below from Matrix as well. I note
>    >> that the offending object can be printed if sent through
>    >> dplyr::tbl_df(). I accept that that printing doesn't provide much info
>    >> on S4 objects. I'd just like those vars to not prevent data.frame-style
>    >> inpsection of the entire object.
>    >>
>    >> I asked this on stack overflow, where commenter provided the lead to the
>    >> workaround below. Is that the best solution?
>    >>
>    >> library(Matrix)
>    >>
>    >> m <- new("dgCMatrix")
>    >> isS4(m)
>    >> #> [1] TRUE
>    >> df <- data.frame(id = 1:2)
>    >> df$matrices <- list(m, m)
>
> This only works by accident (I think), and fails for
>
>  df <- data.frame(id = 1)
>  df$matrices <- list(m, m)
>
>    > df <- data.frame(id = 1)
>    > df$matrices <- list(m, m)
>    Error in `$<-.data.frame`(`*tmp*`, "matrices", value = list(<S4 object of
>class "dgCMatrix">,  :
>    replacement has 2 rows, data has 1
>    >
>
>
>    >> df
>    >> #> Error in prettyNum(.Internal(format(x, trim, digits, nsmall, width,
>3L, : first argument must be atomic
>    >> #> Error in prettyNum(.Internal(format(x, trim, digits, nsmall, width,
>3L, : first argument must be atomic
>
> Hmm,
> As 'data.frame' is just an S3 class there is no formal
> definition to go with and in this sense you are of course entitled
> to all expectations. ;-)
> Even though data frames are internally coded as lists, I
> strongly believe data frames should be taught as (and thought of)
>          "generalized matrices"
> in the sense that data frames should be thought of n (say) rows
> and p (say) columns.
>
> The help pages  for  data.frame()  and as.data.frame()
> should make it clear that you can *not* put all kinds of entries
> into data frame columns, but I agree the documentation is vague
> and probably has to remain vague,
> because if you provide  as.data.frame()  methods for your class
> you should be able to go quite far.
>
> In addition, the data frame columns need to fulfill properties, e.g.,
> subsetting (aka "indexing") and also subassignment ( df[i,j] <- v )
>
> Now the real "problem" here is that the '$<-' and '[<-'  methods
> for data frames which you call via  df$m <- v  or  df[,co] <- V
> are too "forgiving". They only check that NROW(.) of the new
> entry corresponds to the nrow(<data.frame>).
> Currently they allow very easy construction of illegal data
> frames(*), as in your present case.
>
> --
> *) Yes, it is hard to say when a data.frame is illegal, as there
>    is no formal definition
>
> There is more to be said and thought about if you really want
> sparse matrices in a data frame, and as 'Matrix' maintainers,
> I'm quite interested *why* you'd want that, but I won't go there
> now.
>
> One last issue though: The idea of allowing to put 'matrix' or
> 'array' into data frames is that each column of the matrix
> becomes a separate column of the data frame
>
>> data.frame(D = diag(3), M = matrix(1:12, 3,4))
>  D.1 D.2 D.3 M.1 M.2 M.3 M.4
> 1  1  0  0  1  4  7  10
> 2  0  1  0  2  5  8  11
> 3  0  0  1  3  6  9  12
>
> .... and that would be quite inefficient for large sparse matrices.
>
> ---------
>
> Final recommendation as a summary:
>
> If  data.frame(.., .., ..) does not work to put entries into a
> data frame, then don't do it, but rather think about how to make
> data.frame() work with your objects -- namely by ensuring that
> as.data.frame() works .. possibly by providing an
> as.data.frame() method.
>
> Best regards,
> Martin Maechler
>


------------------------------

Message: 2
Date: Thu, 14 Jan 2016 12:47:37 +0100
From: "Frank S." <f_j_...@hotmail.com>
To: "r-help@r-project.org" <r-help@r-project.org>
Subject: [R] Overlapping subject-specific histograms
Message-ID: <bay168-w415d1696bc42de5e907d3fba...@phx.gbl>
Content-Type: text/plain; charset="UTF-8"

Dear R users,

First of all, excuse me if my doubt is very trivial, but so far I haven't been
able to solve it.
My question is this: I have a data frame which contains repeated measurements
on 4 subjects coded
as "id", and I want to plot, for each subject, not only the corresponding
"counts" variable histogram,
but also overlapping to the right side the corresponding results of "sim"
variable (I want to do it in basic
R code, i.e., without any specific R package). I have almost the right code
(see the example code below),
but I can not overlap the "sim" variable.

Thanks in advance for suggestions!!

Frank

data <- data.frame(id =  rep(c(1,3,4,7), c(9,5,3,3)),
    count = c(0, 10, 15, 0, 16, 7, 14, 11, 12, 1, 8, 17, 19, 0, 9, 10, 14, 2,
3, 10),
    sims =  c(1, 9, 15, 1, 14, 5, 12, 10, 12, 2, 6, 15, 18, 1, 9, 9, 12, 5, 3,
9))

# The actual code I have
# ------------------------------
windows(height = 5, width = 5)
par(mfrow = c(2, 2), oma = c(1, 2, 2, 1), mar=c(3, 2, 1, 1), las = 1)
for(i in 1:length(unique(data$id))){
  kat <- factor(data$id, labels = 1:length(unique(data$id)))
  plot(data$count[kat == i],
  type = "h", col = 1, lwd = 3, xaxt = "n", xlab ="", main = "",
  xlim = c(1, max(table(data$id))), ylim = c(0, 20))
  axis(1, at = 1:max(table(data$id)))
  mtext( bquote(paste("id = ", .(unique(data$id)[i]))), side = 3, cex = 0.9,
line = 0.5)
  tab <- table( as.matrix( data$id ) )
  dist.overlap <- 0.4 # Distance of right overlapping of the "sim" variable
  # points( factor(names(tab)) + dist.overlap, data$sim[kat == i] , type="h",
col=2, lw =4)  ##  =======>  Line I can not solve
 }

    [[alternative HTML version deleted]]


------------------------------

Message: 3
Date: Thu, 14 Jan 2016 12:03:16 +0000
From: PIKAL Petr <petr.pi...@precheza.cz>
To: "Frank S." <f_j_...@hotmail.com>, "r-help@r-project.org"
    <r-help@r-project.org>
Subject: Re: [R] Overlapping subject-specific histograms
Message-ID:
    <6e8d8dfde5fa5d4abcb8508389d1bf88c5009...@srvexchmbx.precheza.cz>
Content-Type: text/plain; charset="utf-8"

Hi

change

points( factor(names(tab)) + dist.overlap, data$sim[kat == i] ,
> type="h", col=2, lw =4)

to

points( 1:length(data$count[kat == i]) + dist.overlap, data$sims[kat == i] ,
type="h", col=2, lw =4)

And do not use html post, your code could be scrammbled.

Cheers
Petr


> -----Original Message-----
> From: R-help [mailto:r-help-boun...@r-project.org] On Behalf Of Frank
> S.
> Sent: Thursday, January 14, 2016 12:48 PM
> To: r-help@r-project.org
> Subject: [R] Overlapping subject-specific histograms
>
> Dear R users,
>
> First of all, excuse me if my doubt is very trivial, but so far I
> haven't been able to solve it.
> My question is this: I have a data frame which contains repeated
> measurements on 4 subjects coded
> as "id", and I want to plot, for each subject, not only the
> corresponding "counts" variable histogram,
> but also overlapping to the right side the corresponding results of
> "sim" variable (I want to do it in basic
> R code, i.e., without any specific R package). I have almost the right
> code (see the example code below),
> but I can not overlap the "sim" variable.
>
> Thanks in advance for suggestions!!
>
> Frank
>
> data <- data.frame(id =  rep(c(1,3,4,7), c(9,5,3,3)),
>    count = c(0, 10, 15, 0, 16, 7, 14, 11, 12, 1, 8, 17, 19, 0, 9, 10,
> 14, 2, 3, 10),
>    sims =  c(1, 9, 15, 1, 14, 5, 12, 10, 12, 2, 6, 15, 18, 1, 9, 9,
> 12, 5, 3, 9))
>
> # The actual code I have
> # ------------------------------
> windows(height = 5, width = 5)
> par(mfrow = c(2, 2), oma = c(1, 2, 2, 1), mar=c(3, 2, 1, 1), las = 1)
> for(i in 1:length(unique(data$id))){
>    kat <- factor(data$id, labels = 1:length(unique(data$id)))
>    plot(data$count[kat == i],
>    type = "h", col = 1, lwd = 3, xaxt = "n", xlab ="", main = "",
>    xlim = c(1, max(table(data$id))), ylim = c(0, 20))
>    axis(1, at = 1:max(table(data$id)))
>    mtext( bquote(paste("id = ", .(unique(data$id)[i]))), side = 3, cex
> = 0.9, line = 0.5)
>    tab <- table( as.matrix( data$id ) )
>    dist.overlap <- 0.4 # Distance of right overlapping of the "sim"
> variable
>    # points( factor(names(tab)) + dist.overlap, data$sim[kat == i] ,
> type="h", col=2, lw =4)  ##  =======>  Line I can not solve
>  }
>
>      [[alternative HTML version deleted]]
>
> ______________________________________________
> R-help@r-project.org mailing list -- To UNSUBSCRIBE and more, see
> https://stat.ethz.ch/mailman/listinfo/r-help
> PLEASE do read the posting guide http://www.R-project.org/posting-
> guide.html
> and provide commented, minimal, self-contained, reproducible code.

________________________________
Tento e-mail a jak?koliv k n?mu p?ipojen? dokumenty jsou d?v?rn? a jsou ur?eny
pouze jeho adres?t?m.
Jestli?e jste obdr?el(a) tento e-mail omylem, informujte laskav? neprodlen?
jeho odes?latele. Obsah tohoto emailu i s p??lohami a jeho kopie vyma?te ze
sv?ho syst?mu.
Nejste-li zam??len?m adres?tem tohoto emailu, nejste opr?vn?ni tento email
jakkoliv u??vat, roz?i?ovat, kop?rovat ?i zve?ej?ovat.
Odes?latel e-mailu neodpov?d? za eventu?ln? ?kodu zp?sobenou modifikacemi ?i
zpo?d?n?m p?enosu e-mailu.

V p??pad?, ?e je tento e-mail sou??st? obchodn?ho jedn?n?:
- vyhrazuje si odes?latel pr?vo ukon?it kdykoliv jedn?n? o uzav?en? smlouvy, a
to z jak?hokoliv d?vodu i bez uveden? d?vodu.
- a obsahuje-li nab?dku, je adres?t opr?vn?n nab?dku bezodkladn? p?ijmout;
Odes?latel tohoto e-mailu (nab?dky) vylu?uje p?ijet? nab?dky ze strany p??jemce
s dodatkem ?i odchylkou.
- trv? odes?latel na tom, ?e p??slu?n? smlouva je uzav?ena teprve v?slovn?m
dosa?en?m shody na v?ech jej?ch n?le?itostech.
- odes?latel tohoto emailu informuje, ?e nen? opr?vn?n uzav?rat za spole?nost
??dn? smlouvy s v?jimkou p??pad?, kdy k tomu byl p?semn? zmocn?n nebo p?semn?
pov??en a takov? pov??en? nebo pln? moc byly adres?tovi tohoto emailu p??padn?
osob?, kterou adres?t zastupuje, p?edlo?eny nebo jejich existence je adres?tovi
?i osob? j?m zastoupen? zn?m?.

This e-mail and any documents attached to it may be confidential and are
intended only for its intended recipients.
If you received this e-mail by mistake, please immediately inform its sender.
Delete the contents of this e-mail with all attachments and its copies from
your system.
If you are not the intended recipient of this e-mail, you are not authorized to
use, disseminate, copy or disclose this e-mail in any manner.
The sender of this e-mail shall not be liable for any possible damage caused by
modifications of the e-mail or by delay with transfer of the email.

In case that this e-mail forms part of business dealings:
- the sender reserves the right to end negotiations about entering into a
contract in any time, for any reason, and without stating any reasoning.
- if the e-mail contains an offer, the recipient is entitled to immediately
accept such offer; The sender of this e-mail (offer) excludes any acceptance of
the offer on the part of the recipient containing any amendment or variation.
- the sender insists on that the respective contract is concluded only upon an
express mutual agreement on all its aspects.
- the sender of this e-mail informs that he/she is not authorized to enter into
any contracts on behalf of the company except for cases in which he/she is
expressly authorized to do so in writing, and such authorization or power of
attorney is submitted to the recipient or the person represented by the
recipient, or the existence of such authorization is known to the recipient of
the person represented by the recipient.

------------------------------

Message: 4
Date: Thu, 14 Jan 2016 16:05:39 +0100 (CET)
From: Olivier ETERRADOSSI <olivier.eterrado...@mines-ales.fr>
To: <r-help@r-project.org>
Subject: [R] unexpected behaviour of an extended time series (using
    packages    spuRs and xts)
Message-ID: <00a401d14edc$ffef75b0$ffce6110$@mines-ales.fr>
Content-Type: text/plain; charset="UTF-8"

Hi list,


I thought I knew how to use extended time series (package xts), but I was
wrong  J  ?


While preparing a toy example for something else, using data provided in
R, I run into an unexpected problem and can?t figure by myself what is
happening below, can anyone of you tell ? I searched the archives but
didn?t locate any answer. Probably it?s trivial, so please forgive  :


I?m using :

R version 3.2.3 (2015-12-10) -- "Wooden Christmas-Tree" / Platform:
x86_64-w64-mingw32/x64 (64-bit)

Packages are updated weekly, sometimes daily.


I take some data from package spuRs :

> library(spuRs)

> data(kew)


I turn the dataframe into time series (by combining each kew[,2:13] one
after each other into a vector, and turning the vector into time series).


One is ts :


>
kew.ts<-ts(data=stock,start=kew$year[1],end=kew$year[length(kew$year)],fre
quency=12)


And the other is xts, it looks fine at first :


> kew.xts<-as.xts(kew.ts)

> periodicity(kew.xts)

Monthly periodicity from janv. 1697 to janv. 1999  # OK

> hist(kew.xts) # OK

> summary(kew.xts)

    Index        kew.xts

 Min.  :1697  Min.  :  0.00

 1st Qu.:1772  1st Qu.: 29.70

 Median :1848  Median : 47.00

 Mean  :1848  Mean  : 51.14

 3rd Qu.:1924  3rd Qu.: 67.60

 Max.  :1999  Max.  :189.00  # OK


> gdata::is.what(kew.xts)

[1] "is.array"        "is.atomic"      "is.double"
"is.index.unique"

[5] "is.matrix"      "is.numeric"      "is.object"      "is.regular"


 [9] "is.time.unique"  "is.unsorted"    "is.xts"          "is.zoo"
# seems OK


# But now, first try :

> plot(kew.xts)

Error in if (on == "years") { :

  valeur manquante l??E / FALSE est requis    # french for ?
missing value where TRUE/FALSE is required ?


# hmmmm, let?s try something else :

> plot(kew.xts['1697-01/1979/']) # OK


> plot(kew.xts['1697-01/1980/'])

Error in if (on == "years") { :

  valeur manquante l??E / FALSE est requis


> plot(kew.xts['1697-01/1979-12/']) # OK


> plot(kew.xts['1697-01/1980-01/'])

Error in if (on == "years") { :

  valeur manquante l??E / FALSE est requis


# but?!  :


> plot(kew.xts['1979-01/1980/']) # OK !!!!!


And so are :

> plot (kew.xts['1978/1980/'])

> plot(kew.xts['1977/1982/'])

> plot(kew.xts['1977-01/1982-12'])  # and so on?


I?m puzzled ! I have probably missed a trivial point? Can someone tell ?


Thanks a lot list, regards, Olivier


--------------------------

Olivier ETERRADOSSI

Ma?e-Assistant, HDR

Ecole des Mines d?Al?(C2MA, site de Pau)

Ing?erie de l'aspect visuel et tactile des mat?aux

P?? Recherche sur les Interactions des Mat?aux avec leur
Environnement ? (RIME)

H?oparc, 2 av. P. Angot, F-64053 PAU CEDEX 9

Tel : 05 59 30 90 35 (direct) - 05 59 30  54 25 (std)

Fax : 05 59 30 63 68

 <http://www.mines-ales.fr/> http://www.mines-ales.fr

 <http://www.mines-telecom.fr/> http://www.mines-telecom.fr


    [[alternative HTML version deleted]]


------------------------------

Message: 5
Date: Thu, 14 Jan 2016 16:20:29 +0100
From: "Frank S." <f_j_...@hotmail.com>
To: PIKAL Petr <petr.pi...@precheza.cz>, "r-help@r-project.org"
    <r-help@r-project.org>
Subject: Re: [R] Overlapping subject-specific histograms
Message-ID: <bay168-w5be014ab0f53728926b0dba...@phx.gbl>
Content-Type: text/plain; charset="UTF-8"

Many thanks Petr!

Best,

Frank

> From: petr.pi...@precheza.cz
> To: f_j_...@hotmail.com; r-help@r-project.org
> Subject: RE: [R] Overlapping subject-specific histograms
> Date: Thu, 14 Jan 2016 12:03:16 +0000
>
> Hi
>
> change
>
> points( factor(names(tab)) + dist.overlap, data$sim[kat == i] ,
> > type="h", col=2, lw =4)
>
> to
>
> points( 1:length(data$count[kat == i]) + dist.overlap, data$sims[kat == i] ,
> type="h", col=2, lw =4)
>
> And do not use html post, your code could be scrammbled.
>
> Cheers
> Petr
>
>
> > -----Original Message-----
> > From: R-help [mailto:r-help-boun...@r-project.org] On Behalf Of Frank
> > S.
> > Sent: Thursday, January 14, 2016 12:48 PM
> > To: r-help@r-project.org
> > Subject: [R] Overlapping subject-specific histograms
> >
> > Dear R users,
> >
> > First of all, excuse me if my doubt is very trivial, but so far I
> > haven't been able to solve it.
> > My question is this: I have a data frame which contains repeated
> > measurements on 4 subjects coded
> > as "id", and I want to plot, for each subject, not only the
> > corresponding "counts" variable histogram,
> > but also overlapping to the right side the corresponding results of
> > "sim" variable (I want to do it in basic
> > R code, i.e., without any specific R package). I have almost the right
> > code (see the example code below),
> > but I can not overlap the "sim" variable.
> >
> > Thanks in advance for suggestions!!
> >
> > Frank
> >
> > data <- data.frame(id =  rep(c(1,3,4,7), c(9,5,3,3)),
> >    count = c(0, 10, 15, 0, 16, 7, 14, 11, 12, 1, 8, 17, 19, 0, 9, 10,
> > 14, 2, 3, 10),
> >    sims =  c(1, 9, 15, 1, 14, 5, 12, 10, 12, 2, 6, 15, 18, 1, 9, 9,
> > 12, 5, 3, 9))
> >
> > # The actual code I have
> > # ------------------------------
> > windows(height = 5, width = 5)
> > par(mfrow = c(2, 2), oma = c(1, 2, 2, 1), mar=c(3, 2, 1, 1), las = 1)
> > for(i in 1:length(unique(data$id))){
> >    kat <- factor(data$id, labels = 1:length(unique(data$id)))
> >    plot(data$count[kat == i],
> >    type = "h", col = 1, lwd = 3, xaxt = "n", xlab ="", main = "",
> >    xlim = c(1, max(table(data$id))), ylim = c(0, 20))
> >    axis(1, at = 1:max(table(data$id)))
> >    mtext( bquote(paste("id = ", .(unique(data$id)[i]))), side = 3, cex
> > = 0.9, line = 0.5)
> >    tab <- table( as.matrix( data$id ) )
> >    dist.overlap <- 0.4 # Distance of right overlapping of the "sim"
> > variable
> >    # points( factor(names(tab)) + dist.overlap, data$sim[kat == i] ,
> > type="h", col=2, lw =4)  ##  =======>  Line I can not solve
> >  }
> >
> >      [[alternative HTML version deleted]]
> >
> > ______________________________________________
> > R-help@r-project.org mailing list -- To UNSUBSCRIBE and more, see
> > https://stat.ethz.ch/mailman/listinfo/r-help
> > PLEASE do read the posting guide http://www.R-project.org/posting-
> > guide.html
> > and provide commented, minimal, self-contained, reproducible code.
>
> ________________________________
> Tento e-mail a jak?liv k n? p?en?okumenty jsou d?? jsou ur?y pouze jeho
> adres?m.
> Jestli?e jste obdr?el(a) tento e-mail omylem, informujte laskav?eprodlen?eho
> odes?tele. Obsah tohoto emailu i s p?ami a jeho kopie vyma?te ze sv? syst?.
> Nejste-li zam?m adres?m tohoto emailu, nejste opr?? tento email jakkoliv
> u??t, roz?i?, kop?vat ?zve?vat.
> Odes?tel e-mailu neodpov? za eventu??kodu zp?nou modifikacemi ?zpo?d?m p?u
> e-mailu.
>
> V p???e je tento e-mail sou?t?bchodn? jedn?:
> - vyhrazuje si odes?tel pr? ukon? kdykoliv jedn? o uzav?smlouvy, a to z
> jak?koliv d? i bez uveden??.
> - a obsahuje-li nab?u, je adres?opr??nab?u bezodkladn??ut; Odes?tel tohoto
> e-mailu (nab?y) vylu?e p??ab?y ze strany p?ce s dodatkem ?odchylkou.
> - trv?des?tel na tom, ?e p??n?mlouva je uzav?teprve v??a?en?shody na v?ech
> jej? n??itostech.
> - odes?tel tohoto emailu informuje, ?e nen?pr??uzav?t za spole?st ???mlouvy s
> v?u p??y k tomu byl p?mn?mocn?nebo p?mn?ov?n a takov?ov?n?ebo pln?oc byly
> adres?vi tohoto emailu p?n?sob?kterou adres?zastupuje, p??eny nebo jejich
> existence je adres?vi ?osob??zastoupen?n?.
>
> This e-mail and any documents attached to it may be confidential and are
> intended only for its intended recipients.
> If you received this e-mail by mistake, please immediately inform its sender.
> Delete the contents of this e-mail with all attachments and its copies from
> your system.
> If you are not the intended recipient of this e-mail, you are not authorized
> to use, disseminate, copy or disclose this e-mail in any manner.
> The sender of this e-mail shall not be liable for any possible damage caused
> by modifications of the e-mail or by delay with transfer of the email.
>
> In case that this e-mail forms part of business dealings:
> - the sender reserves the right to end negotiations about entering into a
> contract in any time, for any reason, and without stating any reasoning.
> - if the e-mail contains an offer, the recipient is entitled to immediately
> accept such offer; The sender of this e-mail (offer) excludes any acceptance
> of the offer on the part of the recipient containing any amendment or
> variation.
> - the sender insists on that the respective contract is concluded only upon
> an express mutual agreement on all its aspects.
> - the sender of this e-mail informs that he/she is not authorized to enter
> into any contracts on behalf of the company except for cases in which he/she
> is expressly authorized to do so in writing, and such authorization or power
> of attorney is submitted to the recipient or the person represented by the
> recipient, or the existence of such authorization is known to the recipient
> of the person represented by the recipient.

    [[alternative HTML version deleted]]


------------------------------

Message: 6
Date: Thu, 14 Jan 2016 15:18:54 +0000 (UTC)
From: Morteza Firouzi <mortezafiro...@yahoo.com>
To: R-help Mailing List <r-help@r-project.org>
Subject: [R] zyp Vs. kendall package for Time Series Trend
Message-ID:
    <875108057.660916.1452784734814.javamail.ya...@mail.yahoo.com>
Content-Type: text/plain; charset="utf-8"

Dear members,
I need to detect trends in time series. To remove the effect of "Lag-1 serial
correlation", it is suggested to use either Yue&Pilon or Zhang method. Both
methods are available in "zyp" package. The package uses "kendall" package for
trend analysis. ?


Based on Yue&Pilon (2002), if the lag-1 serial correlation is significant, TFPW
method will remove the effects of it prior to the?trend test; otherwise trend
test will be applied on original time series.?

I've compared the results of a sample time series with non-significant lag-1
serial correlation, using both zyp & kendall packages.?"yuepilon" method in
"zyp" gives me the following results:tau: 0.075 & sig: 0.388
while "kendall"?package gives me this:?
tau: 0.109 & sig: 0.216


The question is :?Does "zyp"?change the significance of the trend?in this case
as well? Is this a malfunction or did I miss something?
I've checked the script and it is mentioned (ln 65)?:?# Prewhiten the original
series
c <- acf(data,lag.max=1,plot=FALSE,na.action=na.pass)$acf[2]


Thank you for your consideration.
Best regards,
Morteza


  <!--#yiv5285967173 P {margin-top:0;margin-bottom:0;}-->
-------------- next part --------------
A non-text attachment was scrubbed...
Name: 1-10-2016 6-09-04 PM.png
Type: image/png
Size: 6799 bytes
Desc: not available
URL:
<https://stat.ethz.ch/pipermail/r-help/attachments/20160114/54f347d5/attachment-0001.png>

------------------------------

Message: 7
Date: Thu, 14 Jan 2016 11:20:17 -0500
From: Mohsen Jafarikia <jafari...@gmail.com>
To: <r-h...@stat.math.ethz.ch>
Subject: [R] read.xlsx - write.xlsx: reading/writing numbers as
    character
Message-ID:
    <cads3ixmguywvxuzkdsxxgrcarop29bfbpi8nwb16ncxjz1q...@mail.gmail.com>
Content-Type: text/plain; charset="UTF-8"

Hello:

I am reading some excel files (each with one sheet) and trying to write
them all in one file. I am not sure if read.xlsx reads some of the columns
as character or write.xlsx writes them as character where they are not
characters. I have 12 columns (2 character and 10 numbers). From 10 number
columns, with float and integer numbers, only 3 of them are recognized
correctly. I was wondering how can I define the the column format for
read.xlsx - write.xlsx.

Here comes a simple example of my code:

ifn1 <- "A.xlsx"
dat1  <- read.xlsx(ifn1, sheetName="A.csv", header = TRUE)

ifn2 <- "F.xlsx"
dat2  <- read.xlsx(ifn2, sheetName="F.csv",header = TRUE)

write.xlsx(dat1,  file="AF.xlsx", sheetName="A",  showNA=FALSE,
row.names=FALSE, append=FALSE)
write.xlsx(dat2,  file="AF.xlsx", sheetName="F",  showNA=FALSE,
row.names=FALSE, append= TRUE)

Thanks in advance!
Mohsen

    [[alternative HTML version deleted]]


------------------------------

Message: 8
Date: Thu, 14 Jan 2016 13:37:42 +0100
From: mara.pfleide...@uni-ulm.de
To: r-help@r-project.org
Subject: [R] parameter constraints in glm() and Bayesian version
Message-ID: <20160114133742.rmeptmtu74woc...@imap.uni-ulm.de>
Content-Type: text/plain;    charset=ISO-8859-1;    DelSp="Yes";
    format="flowed"

Hello,

I'm a mathematics student at Ulm University and currently I am working
on my bachelor thesis about a Poisson regression model.

For this, I am using the function glm () in R which is working very well.
But still I have two questions to improve my model and I hope that you
could help me:

(i) Is there a possibility to set constraints on the regression
parameters in glm() or is there another function in R?
Specifically, my paramters should be constrained to be positive as
negative parameters wouldn't make sense. How can I do this in R
(preferably with glm() or similar functions)?

(ii) Is there a Bayesian version of the glm()-function where I can
specify the prior distribution for my regression parameters?

Thanks in advance!
Kind regards,
Mara Pfleiderer


------------------------------

Message: 9
Date: Thu, 14 Jan 2016 13:42:10 +0000
From: Malcolm Perry <mgperr...@gmail.com>
To: r-help@r-project.org
Subject: [R] R: layout() affects margin size in subfigures [unexpected
    behaviour]
Message-ID:
    <CADfHdv6=kuxszvvnevgd9kxx18ckit6vegpsn7a2i+q6mfz...@mail.gmail.com>
Content-Type: text/plain; charset="UTF-8"

The absolute margin size of figures in R seems to be affected by the layout
of the plot, which i think is surprising (not sure if it qualifies as a
bug). The following plots have different margins sizes, with the 1x3 plot
margins being smaller (thus giving a larger plot area). This is causing
havoc with a package I am writing to automatically generate composite
figures, since labels are positioned differently depending on the number of
panels.

plot_box <- function() {
        plot(1, 1, type='n', bty='n', xaxt='n', yaxt='n', xlab='', ylab='')
        box(lwd = 6)
        box("figure", lwd=6, col='red')
}

png("margin_test_1.png", width=1000, height=500)
par(oma=c(0,0,0,0))
layout(t(1:2))
par(mar=c(3, 3, 3, 3))
plot_box()
par(mar=c(3, 3, 3, 3))
plot_box()
dev.off()

png("margin_test_2.png", width=1500, height=500)
par(oma=c(0,0,0,0))
layout(t(1:3))
par(mar=c(3, 3, 3, 3))
plot_box()
par(mar=c(3, 3, 3, 3))
plot_box()
par(mar=c(3, 3, 3, 3))
plot_box()
dev.off()

I have also posted this question to StackOverflow, and it has images of the
graphical output which illustrate the problem better:
http://stackoverflow.com/questions/34790682/r-layout-affects-margin-size-in-plot-regions

Thanks,

Malcolm

PS I was unsure if this question belonged to help or devel - I will repost
on devel if it is likely to get better answers.

    [[alternative HTML version deleted]]


------------------------------

Message: 10
Date: Thu, 14 Jan 2016 11:29:16 -0500
From: jim holtman <jholt...@gmail.com>
To: Mohsen Jafarikia <jafari...@gmail.com>
Cc: r-help <r-h...@stat.math.ethz.ch>
Subject: Re: [R] read.xlsx - write.xlsx: reading/writing numbers as
    character
Message-ID:
    <CAAxdm-7tTcbs-KvCwoR-ctDcq2t3UzeUFuz65aXm=rjoufu...@mail.gmail.com>
Content-Type: text/plain; charset="UTF-8"

Take a look at the data coming in since you may have something that looks
like characters (maybe 'blanks').  What you think is numeric in EXCEL might
not be.?


Jim Holtman
Data Munger Guru

What is the problem that you are trying to solve?
Tell me what you want to do, not how you want to do it.

On Thu, Jan 14, 2016 at 11:20 AM, Mohsen Jafarikia <jafari...@gmail.com>
wrote:

> Hello:
>
> I am reading some excel files (each with one sheet) and trying to write
> them all in one file. I am not sure if read.xlsx reads some of the columns
> as character or write.xlsx writes them as character where they are not
> characters. I have 12 columns (2 character and 10 numbers). From 10 number
> columns, with float and integer numbers, only 3 of them are recognized
> correctly. I was wondering how can I define the the column format for
> read.xlsx - write.xlsx.
>
> Here comes a simple example of my code:
>
> ifn1 <- "A.xlsx"
> dat1  <- read.xlsx(ifn1, sheetName="A.csv", header = TRUE)
>
> ifn2 <- "F.xlsx"
> dat2  <- read.xlsx(ifn2, sheetName="F.csv",header = TRUE)
>
> write.xlsx(dat1,  file="AF.xlsx", sheetName="A",  showNA=FALSE,
> row.names=FALSE, append=FALSE)
> write.xlsx(dat2,  file="AF.xlsx", sheetName="F",  showNA=FALSE,
> row.names=FALSE, append= TRUE)
>
> Thanks in advance!
> Mohsen
>
>        [[alternative HTML version deleted]]
>
> ______________________________________________
> R-help@r-project.org mailing list -- To UNSUBSCRIBE and more, see
> https://stat.ethz.ch/mailman/listinfo/r-help
> PLEASE do read the posting guide
> http://www.R-project.org/posting-guide.html
> and provide commented, minimal, self-contained, reproducible code.
>

    [[alternative HTML version deleted]]


------------------------------

Message: 11
Date: Thu, 14 Jan 2016 11:36:26 -0500
From: Mohsen Jafarikia <jafari...@gmail.com>
To: jim holtman <jholt...@gmail.com>
Cc: r-help <r-h...@stat.math.ethz.ch>
Subject: Re: [R] read.xlsx - write.xlsx: reading/writing numbers as
    character
Message-ID:
    <cads3ixkxorxfvuwqvz7ddqmkkrmdmbrmzujd8xifcqiwxn6...@mail.gmail.com>
Content-Type: text/plain; charset="UTF-8"

Thanks for the comment Jim. There is no blank cell. All have numbers.

Mohsen

On Thu, Jan 14, 2016 at 11:29 AM, jim holtman <jholt...@gmail.com> wrote:

> Take a look at the data coming in since you may have something that looks
> like characters (maybe 'blanks').  What you think is numeric in EXCEL might
> not be.?
>
>
> Jim Holtman
> Data Munger Guru
>
> What is the problem that you are trying to solve?
> Tell me what you want to do, not how you want to do it.
>
> On Thu, Jan 14, 2016 at 11:20 AM, Mohsen Jafarikia <jafari...@gmail.com>
> wrote:
>
>> Hello:
>>
>> I am reading some excel files (each with one sheet) and trying to write
>> them all in one file. I am not sure if read.xlsx reads some of the columns
>> as character or write.xlsx writes them as character where they are not
>> characters. I have 12 columns (2 character and 10 numbers). From 10 number
>> columns, with float and integer numbers, only 3 of them are recognized
>> correctly. I was wondering how can I define the the column format for
>> read.xlsx - write.xlsx.
>>
>> Here comes a simple example of my code:
>>
>> ifn1 <- "A.xlsx"
>> dat1  <- read.xlsx(ifn1, sheetName="A.csv", header = TRUE)
>>
>> ifn2 <- "F.xlsx"
>> dat2  <- read.xlsx(ifn2, sheetName="F.csv",header = TRUE)
>>
>> write.xlsx(dat1,  file="AF.xlsx", sheetName="A",  showNA=FALSE,
>> row.names=FALSE, append=FALSE)
>> write.xlsx(dat2,  file="AF.xlsx", sheetName="F",  showNA=FALSE,
>> row.names=FALSE, append= TRUE)
>>
[[elided Yahoo spam]]
>> Mohsen
>>
>>        [[alternative HTML version deleted]]
>>
>> ______________________________________________
>> R-help@r-project.org mailing list -- To UNSUBSCRIBE and more, see
>> https://stat.ethz.ch/mailman/listinfo/r-help
>> PLEASE do read the posting guide
>> http://www.R-project.org/posting-guide.html
>> and provide commented, minimal, self-contained, reproducible code.
>>
>
>

    [[alternative HTML version deleted]]


------------------------------

Message: 12
Date: Thu, 14 Jan 2016 11:48:39 -0500
From: Sarah Goslee <sarah.gos...@gmail.com>
To: Malcolm Perry <mgperr...@gmail.com>
Cc: r-help <r-help@r-project.org>
Subject: Re: [R] R: layout() affects margin size in subfigures
    [unexpected    behaviour]
Message-ID:
    <CAM_vju=w5jouywkrnam6n7yh4oygo6xf63sbgmqpgptfb02...@mail.gmail.com>
Content-Type: text/plain; charset=UTF-8

You're setting margin using mar, which is in terms of lines, which is,
well, difficult to manage properly.

    ?mar? A numerical vector of the form ?c(bottom, left, top, right)?
          which gives the number of lines of margin to be specified on
          the four sides of the plot.  The default is ?c(5, 4, 4, 2) +
          0.1?.

If you use mai instead, you will get a consistent physical size.


    ?mai? A numerical vector of the form ?c(bottom, left, top, right)?
          which gives the margin size specified in inches.

See also this bit of ?par:

    The meaning of ?character size? is not well-defined: this is set
    up for the device taking ?pointsize? into account but often not
    the actual font family in use.  Internally the corresponding pars
    (?cra?, ?cin?, ?cxy? and ?csi?) are used only to set the
    inter-line spacing used to convert ?mar? and ?oma? to physical
    margins.  (The same inter-line spacing multiplied by ?lheight? is
    used for multi-line strings in ?text? and ?strheight?.)

Sarah


On Thu, Jan 14, 2016 at 8:42 AM, Malcolm Perry <mgperr...@gmail.com> wrote:
> The absolute margin size of figures in R seems to be affected by the layout
> of the plot, which i think is surprising (not sure if it qualifies as a
> bug). The following plots have different margins sizes, with the 1x3 plot
> margins being smaller (thus giving a larger plot area). This is causing
> havoc with a package I am writing to automatically generate composite
> figures, since labels are positioned differently depending on the number of
> panels.
>
> plot_box <- function() {
>        plot(1, 1, type='n', bty='n', xaxt='n', yaxt='n', xlab='', ylab='')
>        box(lwd = 6)
>        box("figure", lwd=6, col='red')
> }
>
> png("margin_test_1.png", width=1000, height=500)
> par(oma=c(0,0,0,0))
> layout(t(1:2))
> par(mar=c(3, 3, 3, 3))
> plot_box()
> par(mar=c(3, 3, 3, 3))
> plot_box()
> dev.off()
>
> png("margin_test_2.png", width=1500, height=500)
> par(oma=c(0,0,0,0))
> layout(t(1:3))
> par(mar=c(3, 3, 3, 3))
> plot_box()
> par(mar=c(3, 3, 3, 3))
> plot_box()
> par(mar=c(3, 3, 3, 3))
> plot_box()
> dev.off()
>
> I have also posted this question to StackOverflow, and it has images of the
> graphical output which illustrate the problem better:
> http://stackoverflow.com/questions/34790682/r-layout-affects-margin-size-in-plot-regions
>
> Thanks,
>
> Malcolm
>
> PS I was unsure if this question belonged to help or devel - I will repost
> on devel if it is likely to get better answers.
>
--
Sarah Goslee
http://www.numberwright.com


------------------------------

Message: 13
Date: Thu, 14 Jan 2016 12:17:48 -0500
From: Jim Holtman <jholt...@gmail.com>
To: Mohsen Jafarikia <jafari...@gmail.com>
Cc: r-help <r-h...@stat.math.ethz.ch>
Subject: Re: [R] read.xlsx - write.xlsx: reading/writing numbers as
    character
Message-ID: <wu2yr8ggciqwr86bpal4oemf.1452791789...@email.android.com>
Content-Type: text/plain; charset="UTF-8"

Write it out as a csv from excel and see what the data looks like. ?That may
help ?in seeing what the problem is.


Sent from my Verizon Wireless 4G LTE Smartphone

<div>-------- Original message --------</div><div>From: Mohsen Jafarikia
<jafari...@gmail.com> </div><div>Date:01/14/2016  11:36  (GMT-05:00)
</div><div>To: jim holtman <jholt...@gmail.com> </div><div>Cc: r-help
<r-h...@stat.math.ethz.ch> </div><div>Subject: Re: [R] read.xlsx - write.xlsx:
reading/writing numbers as character </div><div>
</div>Thanks for the comment Jim. There is no blank cell. All have numbers.

Mohsen

On Thu, Jan 14, 2016 at 11:29 AM, jim holtman <jholt...@gmail.com> wrote:
Take a look at the data coming in since you may have something that looks like
characters (maybe 'blanks').  What you think is numeric in EXCEL might not be.?


Jim Holtman
Data Munger Guru

What is the problem that you are trying to solve?
Tell me what you want to do, not how you want to do it.

On Thu, Jan 14, 2016 at 11:20 AM, Mohsen Jafarikia <jafari...@gmail.com> wrote:
Hello:

I am reading some excel files (each with one sheet) and trying to write
them all in one file. I am not sure if read.xlsx reads some of the columns
as character or write.xlsx writes them as character where they are not
characters. I have 12 columns (2 character and 10 numbers). From 10 number
columns, with float and integer numbers, only 3 of them are recognized
correctly. I was wondering how can I define the the column format for
read.xlsx - write.xlsx.

Here comes a simple example of my code:

ifn1 <- "A.xlsx"
dat1  <- read.xlsx(ifn1, sheetName="A.csv", header = TRUE)

ifn2 <- "F.xlsx"
dat2  <- read.xlsx(ifn2, sheetName="F.csv",header = TRUE)

write.xlsx(dat1,  file="AF.xlsx", sheetName="A",  showNA=FALSE,
row.names=FALSE, append=FALSE)
write.xlsx(dat2,  file="AF.xlsx", sheetName="F",  showNA=FALSE,
row.names=FALSE, append= TRUE)

Thanks in advance!
Mohsen

        [[alternative HTML version deleted]]

______________________________________________
R-help@r-project.org mailing list -- To UNSUBSCRIBE and more, see
https://stat.ethz.ch/mailman/listinfo/r-help
PLEASE do read the posting guide http://www.R-project.org/posting-guide.html
and provide commented, minimal, self-contained, reproducible code.


    [[alternative HTML version deleted]]


------------------------------

Message: 14
Date: Thu, 14 Jan 2016 09:36:26 -0800
From: David Winsemius <dwinsem...@comcast.net>
To: CG Pettersson <cg.petters...@lantmannen.com>
Cc: "r-help@r-project.org" <r-help@r-project.org>
Subject: Re: [R] Problems with data structure when using plsr() from
    package    pls
Message-ID: <47a5e3b0-b334-43bf-9a5d-60fadb167...@comcast.net>
Content-Type: text/plain; charset=utf-8


> On Jan 14, 2016, at 2:33 AM, CG Pettersson <cg.petters...@lantmannen.com>
> wrote:
>
> Dear Jeff,
> thanks for the effort, but the use of I() when preparing the dataset is
> suggested by the authors (Mevik & Wehrens, section 3.2):
>
> +If Z is a matrix, it has to be protected by the ?protect function? I() in
> calls
> +to data.frame: mydata <- data.frame(..., Z = I(Z)). Otherwise, it will be
> split into
> +separate variables for each column, and there will be no variable called Z
> in the data frame,
> +so we cannot use Z in the formula. One can also add the matrix to an
> existing data frame:
> +R> mydata <- data.frame(...)
> +R> mydata$Z <- Z
>
> In the dataset "gasoline" that is supplied with the pls package, there are
> two variables; octane and NIR, where NIR is a frame with 401 columns and
> possible to work with like:
> plsr(octane ~NIR, data = gasoline)
> I thought "gasoline" was made like the example above, but I must be missing
> something else.
>
> Whatever I do ends with " invalid type (list) for variable 'n96'"

Was `n96` a list before you put a copy of it into the `frame1`-object? Maybe it
wasn't a simple matrix. You need at the very least to post the output of
str(n96). Also .... never use attach().

--
David.

>
> So I am still stuck
> /CG
>
> Fr?n: Jeff Newmiller [mailto:jdnew...@dcn.davis.ca.us]
> Skickat: den 14 januari 2016 05:16
> Till: CG Pettersson; r-help@r-project.org
> ?mne: Re: [R] Problems with data structure when using plsr() from package pls
>
> Using I() in the data.frame seems ill-advised to me. You complain about 96
> variables but from reading your explanation that seems to be what your data
> are. I have no idea whether it makes sense to NOT have 96 variables if that
> is what your data are. Note that a reproducible example supplied by you might
> help us guess better, but it might just be that your expectations are wrong.
> --
> Sent from my phone. Please excuse my brevity.
> On January 13, 2016 11:02:25 AM PST, CG Pettersson
> <cg.petters...@lantmannen.com> wrote:
> R version 3.2.3, W7 64bit.
>
> Dear all!
>
> I am trying to make pls-regression using plsr() from package pls, with Mevik
> & Wehrens (2007) as tutorial and the datasets from the package.
> Everything works real nice as long as I use the supplied datasets, but I
> don?t understand how to prepare my own data.
> This is what I have done:
> frame1 <- data.frame(gushVM, I(n96))
>
> Where gushVM is a vector with fifteen reference analysis values of a quality
> problem in grain and n96 is a matrix with fifteen rows and 96 columns from an
> electronic nose. I try to copy the methods as in 3.2 in Mevik & Wehrens, and
> want to keep n96 as one variable to avoid addressing 96 different variables
> in the plsr call. If I don?t use I() in the call I get 96 variables instead.
> Looking at the data
> frame by
> summary(frame1) get a return quite like summary(gasoline) from the package
> (not shown here).
> But when I try to use plsr() with my own data it doesn?t work due to an error
> in the data structure:
> pls1 <- plsr(gushVM ~ n96, data = frame1)
> Error in model.frame.default(formula = gushVM ~ n96, data = frame1) :
>  invalid type (list) for variable 'n96'
>
> So, n96 has turned into a list, and that is a problem. If gushVM is a vector
> (one variable) och a matrix (five variables) does not seem to change
> anything, managing n96 is the problem
> I have tried all alternative ways of creating a proper data frame suggested
> in the article with exactly the same result.
> I have tried the docum
> entation
> for data.frame() but I probably don?t understand what it says.
>
> What should I do to change "n96" into something better than "list"?
>
> Thanks
> /CG
>
> Med v?nlig h?lsning/Best regards
> CG Pettersson
> Scientific Project Manager, PhD
> ______________________
> Lantm?nnen Corporate R&D
> Phone:  +46 10 556 19 85
> Mobile: + 46 70 330 66 85
> Email: cg.petters...@lantmannen.com<mailto:cg.petters...@lantmannen.com>
> Visiting Address: S:t G?ransgatan 160 A
> Address: Box 30192, SE-104 25 Stockholm
> Webb: http://www.lantmannen.com<http://www.lantmannen.com/>
> Registered Office: Stockholm
> Before printing, think about the environment
>
>
> [[alternative HTML version deleted]]
>
> R-help@r-project.org mailing list -- To UNSUBSCRIBE and more, see
> https://stat.ethz.ch/mailman/listinfo/r-help
> PLEASE do read the posting guide http://www.R-project.org/posting-guide.html
> and provide commented, minimal, self-contained, reproducible code.
> ______________________________________________
> R-help@r-project.org mailing list -- To UNSUBSCRIBE and more, see
> https://stat.ethz.ch/mailman/listinfo/r-help
> PLEASE do read the posting guide http://www.R-project.org/posting-guide.html
> and provide commented, minimal, self-contained, reproducible code.

David Winsemius
Alameda, CA, USA


------------------------------

Message: 15
Date: Thu, 14 Jan 2016 12:59:49 -0500
From: Mohsen Jafarikia <jafari...@gmail.com>
To: Jim Holtman <jholt...@gmail.com>
Cc: r-help <r-h...@stat.math.ethz.ch>
Subject: Re: [R] read.xlsx - write.xlsx: reading/writing numbers as
    character
Message-ID:
    <CADs3iX=P+F-09ewUaNaeAiRfc+o33pSD1jXR=uptd2ao6oa...@mail.gmail.com>
Content-Type: text/plain; charset="UTF-8"

It looks okay on CSV too.

On Thu, Jan 14, 2016 at 12:17 PM, Jim Holtman <jholt...@gmail.com> wrote:

> Write it out as a csv from excel and see what the data looks like.  That
> may help  in seeing what the problem is.
>
>
> Sent from my Verizon Wireless 4G LTE Smartphone
>
>
> -------- Original message --------
> From: Mohsen Jafarikia
> Date:01/14/2016 11:36 (GMT-05:00)
> To: jim holtman
> Cc: r-help
> Subject: Re: [R] read.xlsx - write.xlsx: reading/writing numbers as
> character
>
> Thanks for the comment Jim. There is no blank cell. All have numbers.
>
> Mohsen
>
> On Thu, Jan 14, 2016 at 11:29 AM, jim holtman <jholt...@gmail.com> wrote:
>
>> Take a look at the data coming in since you may have something that looks
>> like characters (maybe 'blanks').  What you think is numeric in EXCEL might
>> not be.?
>>
>>
>> Jim Holtman
>> Data Munger Guru
>>
>> What is the problem that you are trying to solve?
>> Tell me what you want to do, not how you want to do it.
>>
>> On Thu, Jan 14, 2016 at 11:20 AM, Mohsen Jafarikia <jafari...@gmail.com>
>> wrote:
>>
>>> Hello:
>>>
>>> I am reading some excel files (each with one sheet) and trying to write
>>> them all in one file. I am not sure if read.xlsx reads some of the
>>> columns
>>> as character or write.xlsx writes them as character where they are not
>>> characters. I have 12 columns (2 character and 10 numbers). From 10
>>> number
>>> columns, with float and integer numbers, only 3 of them are recognized
>>> correctly. I was wondering how can I define the the column format for
>>> read.xlsx - write.xlsx.
>>>
>>> Here comes a simple example of my code:
>>>
>>> ifn1 <- "A.xlsx"
>>> dat1  <- read.xlsx(ifn1, sheetName="A.csv", header = TRUE)
>>>
>>> ifn2 <- "F.xlsx"
>>> dat2  <- read.xlsx(ifn2, sheetName="F.csv",header = TRUE)
>>>
>>> write.xlsx(dat1,  file="AF.xlsx", sheetName="A",  showNA=FALSE,
>>> row.names=FALSE, append=FALSE)
>>> write.xlsx(dat2,  file="AF.xlsx", sheetName="F",  showNA=FALSE,
>>> row.names=FALSE, append= TRUE)
>>>
[[elided Yahoo spam]]
>>> Mohsen
>>>
>>>        [[alternative HTML version deleted]]
>>>
>>> ______________________________________________
>>> R-help@r-project.org mailing list -- To UNSUBSCRIBE and more, see
>>> https://stat.ethz.ch/mailman/listinfo/r-help
>>> PLEASE do read the posting guide
>>> http://www.R-project.org/posting-guide.html
>>> and provide commented, minimal, self-contained, reproducible code.
>>>
>>
>>
>

    [[alternative HTML version deleted]]


------------------------------

Message: 16
Date: Thu, 14 Jan 2016 14:30:59 -0500
From: Mohsen Jafarikia <jafari...@gmail.com>
To: Jim Holtman <jholt...@gmail.com>
Cc: r-help <r-h...@stat.math.ethz.ch>
Subject: Re: [R] read.xlsx - write.xlsx: reading/writing numbers as
    character
Message-ID:
    <cads3ixnux3zdon0c3vd14n3ow4svum5wmyybptm01xljf1b...@mail.gmail.com>
Content-Type: text/plain; charset="UTF-8"

Hi Jim,

I found where the problem is. I had some characters in my list.

[[elided Yahoo spam]]

Mohsen

On Thu, Jan 14, 2016 at 12:17 PM, Jim Holtman <jholt...@gmail.com> wrote:

> Write it out as a csv from excel and see what the data looks like.  That
> may help  in seeing what the problem is.
>
>
> Sent from my Verizon Wireless 4G LTE Smartphone
>
>
> -------- Original message --------
> From: Mohsen Jafarikia
> Date:01/14/2016 11:36 (GMT-05:00)
> To: jim holtman
> Cc: r-help
> Subject: Re: [R] read.xlsx - write.xlsx: reading/writing numbers as
> character
>
> Thanks for the comment Jim. There is no blank cell. All have numbers.
>
> Mohsen
>
> On Thu, Jan 14, 2016 at 11:29 AM, jim holtman <jholt...@gmail.com> wrote:
>
>> Take a look at the data coming in since you may have something that looks
>> like characters (maybe 'blanks').  What you think is numeric in EXCEL might
>> not be.?
>>
>>
>> Jim Holtman
>> Data Munger Guru
>>
>> What is the problem that you are trying to solve?
>> Tell me what you want to do, not how you want to do it.
>>
>> On Thu, Jan 14, 2016 at 11:20 AM, Mohsen Jafarikia <jafari...@gmail.com>
>> wrote:
>>
>>> Hello:
>>>
>>> I am reading some excel files (each with one sheet) and trying to write
>>> them all in one file. I am not sure if read.xlsx reads some of the
>>> columns
>>> as character or write.xlsx writes them as character where they are not
>>> characters. I have 12 columns (2 character and 10 numbers). From 10
>>> number
>>> columns, with float and integer numbers, only 3 of them are recognized
>>> correctly. I was wondering how can I define the the column format for
>>> read.xlsx - write.xlsx.
>>>
>>> Here comes a simple example of my code:
>>>
>>> ifn1 <- "A.xlsx"
>>> dat1  <- read.xlsx(ifn1, sheetName="A.csv", header = TRUE)
>>>
>>> ifn2 <- "F.xlsx"
>>> dat2  <- read.xlsx(ifn2, sheetName="F.csv",header = TRUE)
>>>
>>> write.xlsx(dat1,  file="AF.xlsx", sheetName="A",  showNA=FALSE,
>>> row.names=FALSE, append=FALSE)
>>> write.xlsx(dat2,  file="AF.xlsx", sheetName="F",  showNA=FALSE,
>>> row.names=FALSE, append= TRUE)
>>>
[[elided Yahoo spam]]
>>> Mohsen
>>>
>>>        [[alternative HTML version deleted]]
>>>
>>> ______________________________________________
>>> R-help@r-project.org mailing list -- To UNSUBSCRIBE and more, see
>>> https://stat.ethz.ch/mailman/listinfo/r-help
>>> PLEASE do read the posting guide
>>> http://www.R-project.org/posting-guide.html
>>> and provide commented, minimal, self-contained, reproducible code.
>>>
>>
>>
>

    [[alternative HTML version deleted]]


------------------------------

Message: 17
Date: Thu, 14 Jan 2016 14:51:58 -0500
From: jim holtman <jholt...@gmail.com>
To: Mohsen Jafarikia <jafari...@gmail.com>
Cc: r-help <r-h...@stat.math.ethz.ch>
Subject: Re: [R] read.xlsx - write.xlsx: reading/writing numbers as
    character
Message-ID:
    <caaxdm-6yme2knzul9pfmjy2+uvam3vtq86zu_f+7-plfwfm...@mail.gmail.com>
Content-Type: text/plain; charset="UTF-8"

That is what usually caused me problems in the past.  Excel does not have
the requirement that a column contain the same 'mode' of a variable.  You
can mix numeric and character in the same column and things will work fine
in Excel; conversion to a data.frame does require the same mode in a
column.?


Jim Holtman
Data Munger Guru

What is the problem that you are trying to solve?
Tell me what you want to do, not how you want to do it.

On Thu, Jan 14, 2016 at 2:30 PM, Mohsen Jafarikia <jafari...@gmail.com>
wrote:

> Hi Jim,
>
> I found where the problem is. I had some characters in my list.
>
[[elided Yahoo spam]]
>
> Mohsen
>
> On Thu, Jan 14, 2016 at 12:17 PM, Jim Holtman <jholt...@gmail.com> wrote:
>
>> Write it out as a csv from excel and see what the data looks like.  That
>> may help  in seeing what the problem is.
>>
>>
>> Sent from my Verizon Wireless 4G LTE Smartphone
>>
>>
>> -------- Original message --------
>> From: Mohsen Jafarikia
>> Date:01/14/2016 11:36 (GMT-05:00)
>> To: jim holtman
>> Cc: r-help
>> Subject: Re: [R] read.xlsx - write.xlsx: reading/writing numbers as
>> character
>>
>> Thanks for the comment Jim. There is no blank cell. All have numbers.
>>
>> Mohsen
>>
>> On Thu, Jan 14, 2016 at 11:29 AM, jim holtman <jholt...@gmail.com> wrote:
>>
>>> Take a look at the data coming in since you may have something that
>>> looks like characters (maybe 'blanks').  What you think is numeric in EXCEL
>>> might not be.?
>>>
>>>
>>> Jim Holtman
>>> Data Munger Guru
>>>
>>> What is the problem that you are trying to solve?
>>> Tell me what you want to do, not how you want to do it.
>>>
>>> On Thu, Jan 14, 2016 at 11:20 AM, Mohsen Jafarikia <jafari...@gmail.com>
>>> wrote:
>>>
>>>> Hello:
>>>>
>>>> I am reading some excel files (each with one sheet) and trying to write
>>>> them all in one file. I am not sure if read.xlsx reads some of the
>>>> columns
>>>> as character or write.xlsx writes them as character where they are not
>>>> characters. I have 12 columns (2 character and 10 numbers). From 10
>>>> number
>>>> columns, with float and integer numbers, only 3 of them are recognized
>>>> correctly. I was wondering how can I define the the column format for
>>>> read.xlsx - write.xlsx.
>>>>
>>>> Here comes a simple example of my code:
>>>>
>>>> ifn1 <- "A.xlsx"
>>>> dat1  <- read.xlsx(ifn1, sheetName="A.csv", header = TRUE)
>>>>
>>>> ifn2 <- "F.xlsx"
>>>> dat2  <- read.xlsx(ifn2, sheetName="F.csv",header = TRUE)
>>>>
>>>> write.xlsx(dat1,  file="AF.xlsx", sheetName="A",  showNA=FALSE,
>>>> row.names=FALSE, append=FALSE)
>>>> write.xlsx(dat2,  file="AF.xlsx", sheetName="F",  showNA=FALSE,
>>>> row.names=FALSE, append= TRUE)
>>>>
[[elided Yahoo spam]]
>>>> Mohsen
>>>>
>>>>        [[alternative HTML version deleted]]
>>>>
>>>> ______________________________________________
>>>> R-help@r-project.org mailing list -- To UNSUBSCRIBE and more, see
>>>> https://stat.ethz.ch/mailman/listinfo/r-help
>>>> PLEASE do read the posting guide
>>>> http://www.R-project.org/posting-guide.html
>>>> and provide commented, minimal, self-contained, reproducible code.
>>>>
>>>
>>>
>>
>

    [[alternative HTML version deleted]]


------------------------------

Message: 18
Date: Thu, 14 Jan 2016 22:36:00 +0100
From: Lorenzo Isella <lorenzo.ise...@gmail.com>
To: "r-help@r-project.org" <r-help@r-project.org>
Subject: [R] Updating a Time Series After Forecast()
Message-ID: <20160114213600.GB1913@localhost.localdomain>
Content-Type: text/plain; charset=us-ascii; format=flowed

Dear All,
Perhaps I am drowning in a cup of water, since I am positive that the
answer will be a one-liner.
Consider the following short script


########################################################
library(forecast)

ts2<-structure(c(339130, 356462, 363234, 378179, 367864, 378337, 392157,
402153, 376361, 392204, 403483, 414034, 391967, 406067, 419464,
434913, 410102, 424795, 437073, 448827, 415569, 430561, 444719,
455764, 419892, 444190, 454648, 466312, 439922, 448963, 465153,
475621, 445502, 457198, 473573, 485764, 463895, 470274, 484390,
490678, 478003, 483570, 499141, 509216, 481395, 492345, 511184,
513420, 483757, 490884, 514966, 515457, 497614, 510139, 523467,
526406, 499784, 519033, 532009, 531260, 521539, 532590, 553118,
557725, 548321, 556832, 578087, 578120, 566116, 580571, 587993,
569985, 534326, 539641, 564824, 568445, 558614, 570192, 594584,
598305, 593769, 598278, 620147, 615884, 611033, 609304, 630458,
624325, 614356, 627192, 649324, 645988, 642965, 645125, 669471,
665529, 664248, 669670, 694719), na.action = structure(1:64, class =
"omit"), .Tsp = c(1991,
2015.5, 4), class = "ts")

fit2 <- auto.arima(ts2, approximation=FALSE,trace=FALSE)

pred2 <- forecast(fit2, h=2)

#######################################################

So, I have an original quarterly time series ts2 and a forecast for 2
quarters pred2.

I would like to combine ts2 and pred2 (just the prediction) into a new
time series (in other words, just stretch a bit ts2).
How can I do that?
Many thanks

Lorenzo


------------------------------

Message: 19
Date: Thu, 14 Jan 2016 21:34:40 +0000
From: Lauren Moscoe <mos...@wisc.edu>
To: "r-help@r-project.org" <r-help@r-project.org>
Subject: [R] Tukey and extracting letters in multcomp
Message-ID:

<cy1pr0601mb143762017c05ecdded789be4b6...@cy1pr0601mb1437.namprd06.prod.outlook.com>

Content-Type: text/plain; charset="UTF-8"

Hello,


I have the following model:


model <- lmer (Y  ~ gen + (1|env) + (1|gen:env))


I would like to use Tukey's method to identify significant pairwise differences
among levels of the factor gen, which has 18 levels. (Env has 3 levels.)


I have been trying to do this using glht and cld in the package multcomp.


This is what I ran, with notes about the output.


tukey.gen <- glht(model, linfct=mcp(gen = "Tukey))


summary(tukey.gen)

# This resulted in 46 warnings that said, "In RET$pfunction("adjusted", ...) :
Completion with error > abseps."


cld(tukey.gen, level=0.05)

# This was my attempt to extract letters to represent Tukey results. I did get
letters for each level of gen, but they came alongside the same warning as
above, repeated over 50 times.


Why am I getting these warnings? Should I not use the results of cld, given
these warnings? How can I avoid the warnings?


I would be very grateful for any advice for how to successfully use Tukey's
method for gen in this model, as well as for how to extract letters to denote
significant differences. Either suggestions for adjusting my code or for a new
approach entirely would be fine.


Thank you,


Lauren


PhD Candidate

Department of Botany

University of Wisconsin-Madison


    [[alternative HTML version deleted]]


------------------------------

Message: 20
Date: Thu, 14 Jan 2016 16:45:44 -0600
From: AASHISH JAIN <aj...@umn.edu>
To: r-help@r-project.org
Subject: [R] Problem with rJava
Message-ID: <121b32db-615e-4148-b8be-5d6e47c86...@umn.edu>
Content-Type: text/plain; charset=us-ascii

Hello,

I am using an R package called Rknots, which uses rJava (and others like
rSymPy, rjson, rJython) and I am getting some error due to rJava. When I run my
R code, the execution gets halted with the following error:

Error in .jcheck() : No running JVM detected. Maybe .jinit() would help. (found
this line in rjava.c)
Calls: computeInvariant ... sympy -> $ -> $ -> hasField -> .jcall -> .jcheck ->
.Call (this line comes from Rknots package when the function computeInvariant
is called)
Execution halted

Note that since I could not install these packages on root level, I installed
them locally on unix OS. Since the other Java and R software appears to be
working, it seems like the error is specific to the rJava package. Possibly
rJava makes some assumptions about the Java installation (perhaps its location)
that cause it to be confused. I would like to know if a non-root Java
installation would cause problems.

FYI, here are the versions of different packages that I currently have:
1. rSymPy_0.2-1.1.tar
2. rJava_0.9-8.tar
3. rjson_0.2.15.tar.gz
4. rJython_0.0-4.tar
5. Rknots_1.2.1.tar

I would really appreciate any help.

I want to apologize if this forum is not a right place to discuss about rJava.

Thanks!
Aashish Jain
Postdoctoral Associate
Department of Chemical Engineering and Material Science
151 Amundson Hall
421 Washington Ave SE
Minneapolis, MN 55455 USA
Ph: +1 612-806-7154


------------------------------

Message: 21
Date: Thu, 14 Jan 2016 19:24:51 -0500
From: ProfJCNash <profjcn...@gmail.com>
To: r-help@r-project.org
Subject: Re: [R] Problem with rJava
Message-ID: <56983c53.4060...@gmail.com>
Content-Type: text/plain; charset=windows-1252

Your post does not have the requested session information that will tell
us your computing environment, nor the version of R.

However, I'm experiencing at least a related problem, as this morning I
updated R (in Linux Mind Rafaela 17.2, so I get an operating system
notice to update via the package manager). Afterwards I ran
update.packages() but could not get rJava to carry out the update,
though other packages did complete. Possibly there is some mismatch
between rJava and R 3.2.3 and/or gcj. I'm a bit surprised this hasn't
surfaced before, as I'm a "slow updater" and 3.2.3 is over a month old now.

Below is the output from the update -- AFTER I ran "R CMD javareconf" as
root -- along with the session information, which shows Ubuntu rather
than the derivative Linux Mint.

Cheers, JN

> update.packages()
rJava :
 Version 0.9-6 installed in /usr/lib/R/site-library
 Version 0.9-8 available at https://rweb.crmda.ku.edu/cran
Update (y/N/c)?  y
trying URL 'https://rweb.crmda.ku.edu/cran/src/contrib/rJava_0.9-8.tar.gz'
Content type 'application/x-gzip' length 656615 bytes (641 KB)
==================================================
downloaded 641 KB

* installing *source* package ?rJava? ...
** package ?rJava? successfully unpacked and MD5 sums checked
checking for gcc... gcc -std=gnu99
checking whether the C compiler works... yes
checking for C compiler default output file name... a.out
checking for suffix of executables...
checking whether we are cross compiling... no
checking for suffix of object files... o
checking whether we are using the GNU C compiler... yes
checking whether gcc -std=gnu99 accepts -g... yes
checking for gcc -std=gnu99 option to accept ISO C89... none needed
checking how to run the C preprocessor... gcc -std=gnu99 -E
checking for grep that handles long lines and -e... /bin/grep
checking for egrep... /bin/grep -E
checking for ANSI C header files... yes
checking for sys/wait.h that is POSIX.1 compatible... yes
checking for sys/types.h... yes
checking for sys/stat.h... yes
checking for stdlib.h... yes
checking for string.h... yes
checking for memory.h... yes
checking for strings.h... yes
checking for inttypes.h... yes
checking for stdint.h... yes
checking for unistd.h... yes
checking for string.h... (cached) yes
checking sys/time.h usability... yes
checking sys/time.h presence... yes
checking for sys/time.h... yes
checking for unistd.h... (cached) yes
checking for an ANSI C-conforming const... yes
checking whether time.h and sys/time.h may both be included... yes
configure: checking whether gcc -std=gnu99 supports static inline...
yes
checking whether setjmp.h is POSIX.1 compatible... yes
checking whether sigsetjmp is declared... yes
checking whether siglongjmp is declared... yes
checking Java support in R... present:
interpreter : '/usr/lib/jvm/default-java/jre/bin/java'
archiver    : '/usr/bin/jar'
compiler    : '/usr/bin/javac'
header prep.: '/usr/bin/javah'
cpp flags  : ''
java libs  : '-L/usr/lib/jvm/java-7-openjdk-amd64/jre/lib/amd64/server
-ljvm'
configure: error: One or more Java configuration variables are not set.
Make sure R is configured with full Java support (including JDK). Run
R CMD javareconf
as root to add Java support to R.

If you don't have root privileges, run
R CMD javareconf -e
to set all Java-related variables and then install rJava.

ERROR: configuration failed for package ?rJava?
* removing ?/usr/lib/R/site-library/rJava?
* restoring previous ?/usr/lib/R/site-library/rJava?

The downloaded source packages are in
    ?/tmp/RtmpXCs91E/downloaded_packages?
Warning message:
In install.packages(update[instlib == l, "Package"], l, contriburl =
contriburl,  :
  installation of package ?rJava? had non-zero exit status
>
> sessionInfo()
R version 3.2.3 (2015-12-10)
Platform: x86_64-pc-linux-gnu (64-bit)
Running under: Ubuntu 14.04.3 LTS

locale:
 [1] LC_CTYPE=en_CA.UTF-8      LC_NUMERIC=C
 [3] LC_TIME=en_CA.UTF-8        LC_COLLATE=en_CA.UTF-8
 [5] LC_MONETARY=en_CA.UTF-8    LC_MESSAGES=en_CA.UTF-8
 [7] LC_PAPER=en_CA.UTF-8      LC_NAME=C
 [9] LC_ADDRESS=C              LC_TELEPHONE=C
[11] LC_MEASUREMENT=en_CA.UTF-8 LC_IDENTIFICATION=C

attached base packages:
[1] stats    graphics  grDevices utils    datasets  methods  base

loaded via a namespace (and not attached):
[1] tools_3.2.3 tcltk_3.2.3
>


On 16-01-14 05:45 PM, AASHISH JAIN wrote:
> Hello,
>
> I am using an R package called Rknots, which uses rJava (and others like
> rSymPy, rjson, rJython) and I am getting some error due to rJava. When I run
> my R code, the execution gets halted with the following error:
>
> Error in .jcheck() : No running JVM detected. Maybe .jinit() would help.
> (found this line in rjava.c)
> Calls: computeInvariant ... sympy -> $ -> $ -> hasField -> .jcall -> .jcheck
> -> .Call (this line comes from Rknots package when the function
> computeInvariant is called)
> Execution halted
>
> Note that since I could not install these packages on root level, I installed
> them locally on unix OS. Since the other Java and R software appears to be
> working, it seems like the error is specific to the rJava package. Possibly
> rJava makes some assumptions about the Java installation (perhaps its
> location) that cause it to be confused. I would like to know if a non-root
> Java installation would cause problems.
>
> FYI, here are the versions of different packages that I currently have:
> 1. rSymPy_0.2-1.1.tar
> 2. rJava_0.9-8.tar
> 3. rjson_0.2.15.tar.gz
> 4. rJython_0.0-4.tar
> 5. Rknots_1.2.1.tar
>
> I would really appreciate any help.
>
> I want to apologize if this forum is not a right place to discuss about rJava.
>
> Thanks!
> Aashish Jain
> Postdoctoral Associate
> Department of Chemical Engineering and Material Science
> 151 Amundson Hall
> 421 Washington Ave SE
> Minneapolis, MN 55455 USA
> Ph: +1 612-806-7154
>
> ______________________________________________
> R-help@r-project.org mailing list -- To UNSUBSCRIBE and more, see
> https://stat.ethz.ch/mailman/listinfo/r-help
> PLEASE do read the posting guide http://www.R-project.org/posting-guide.html
> and provide commented, minimal, self-contained, reproducible code.
>


------------------------------

Message: 22
Date: Thu, 14 Jan 2016 23:18:35 -0500

To: "r-help@r-project.org" <r-help@r-project.org>
Subject: [R] Multiplication of high dimensional array

Content-Type: text/plain; charset=us-ascii

In one of my applications, I need to perform following task in R:


    svector <- array(0, dim=c(5, 100000, 360),
dimnames=list(c('s1','s2','s3','s4','s5'), NULL, NULL)))


    tmatrix <- array(0, dim=c(100000, 360, 5, 5), dimnames=list(NULL, NULL,
c('s1','s2','s3','s4','s5'), c('s1','s2','s3','s4','s5'))))

    #My algorithms compute all the elements in tmatrix  (transition matrix
among states from time t to t+1, for all entities represented by l index)

    #do transition for all l for t=1 to 359
    for (l in 1:100000)
    {
      for(t in 1:359)
      {
          svector [, l,t+1] <- tmatrix[l,t,,] %*% svector [,l,t]
      }
  }

The double loops make computation slow. I have been trying to see I can treat
the svector and tmatrix as tensors, and use mul.tensor in tensorR to vectorize
the computation, but so far I ways get one message or another indicating my
incorrect usage. Can tensorR or any other package be used here to simply the
calculation? If it can, would you kindly give some sample code

[[elided Yahoo spam]]


------------------------------

Message: 23
Date: Thu, 14 Jan 2016 21:26:49 -0800
From: jpm miao <miao...@gmail.com>
To: r-help <r-help@r-project.org>
Subject: [R] How can we let "multiplot.R" return a plot?
Message-ID:
    <cabcx46cjrfiz0-anxmz32qp84g2q05xed9s1b1igytu0v4n...@mail.gmail.com>
Content-Type: text/plain; charset="UTF-8"

Hi,

  The function "ggplot" does plot and return a plot. For example, we can
write:

y = ggplot(.. .....)  Then y is  a plot.

  How can we modify the multiplot function so that it can also return a
plot?  Multiplot.R is here:

  http://www.cookbook-r.com/Graphs/Multiple_graphs_on_one_page_(ggplot2)/,
and the code is as below.

[[elided Yahoo spam]]

  Thanks,

Miao

# Multiple plot function # # ggplot objects can be passed in ..., or to
plotlist (as a list of ggplot objects) # - cols: Number of columns in layout #
- layout: A matrix specifying the layout. If present, 'cols' is ignored. # #
If the layout is something like matrix(c(1,2,3,3), nrow=2, byrow=TRUE), #
then plot 1 will go in the upper left, 2 will go in the upper right, and #
3 will go all the way across the bottom. # multiplot <- function(...,
plotlist=NULL, file, cols=1, layout=NULL) { library(grid) # Make a list
from the ... arguments and plotlist plots <- c(list(...), plotlist)
numPlots = length(plots) # If layout is NULL, then use 'cols' to determine
layout if (is.null(layout)) { # Make the panel # ncol: Number of columns of
plots # nrow: Number of rows needed, calculated from # of cols layout <-
matrix(seq(1, cols * ceiling(numPlots/cols)), ncol = cols, nrow =
ceiling(numPlots/cols)) } if (numPlots==1) { print(plots[[1]]) } else { #
Set up the page grid.newpage() pushViewport(viewport(layout =
grid.layout(nrow(layout), ncol(layout)))) # Make each plot, in the correct
location for (i in 1:numPlots) { # Get the i,j matrix positions of the
regions that contain this subplot matchidx <- as.data.frame(which(layout ==
i, arr.ind = TRUE)) print(plots[[i]], vp = viewport(layout.pos.row =
matchidx$row, layout.pos.col = matchidx$col)) } } }

    [[alternative HTML version deleted]]


------------------------------

Message: 24
Date: Thu, 14 Jan 2016 21:43:20 -0800
From: David Winsemius <dwinsem...@comcast.net>
To: jpm miao <miao...@gmail.com>
Cc: r-help <r-help@r-project.org>
Subject: Re: [R] How can we let "multiplot.R" return a plot?
Message-ID: <3d69e829-76ac-402b-a82b-de249052c...@comcast.net>
Content-Type: text/plain; charset=us-ascii


> On Jan 14, 2016, at 9:26 PM, jpm miao <miao...@gmail.com> wrote:
>
> Hi,
>
>  The function "ggplot" does plot and return a plot. For example, we can
> write:
>
> y = ggplot(.. .....)  Then y is  a plot.
>
>  How can we modify the multiplot function so that it can also return a
> plot?  Multiplot.R is here:
>
>  http://www.cookbook-r.com/Graphs/Multiple_graphs_on_one_page_(ggplot2)/,
> and the code is as below.
>
[[elided Yahoo spam]]
>
>  Thanks,
>
> Miao
>
> # Multiple plot function # # ggplot objects can be passed in ..., or to
> plotlist (as a list of ggplot objects) # - cols: Number of columns in layout #
> - layout: A matrix specifying the layout. If present, 'cols' is ignored. # #
> If the layout is something like matrix(c(1,2,3,3), nrow=2, byrow=TRUE), #
> then plot 1 will go in the upper left, 2 will go in the upper right, and #
> 3 will go all the way across the bottom. # multiplot <- function(...,
> plotlist=NULL, file, cols=1, layout=NULL) { library(grid) # Make a list
> from the ... arguments and plotlist plots <- c(list(...), plotlist)
> numPlots = length(plots) # If layout is NULL, then use 'cols' to determine
> layout if (is.null(layout)) { # Make the panel # ncol: Number of columns of
> plots # nrow: Number of rows needed, calculated from # of cols layout <-
> matrix(seq(1, cols * ceiling(numPlots/cols)), ncol = cols, nrow =
> ceiling(numPlots/cols)) } if (numPlots==1) { print(plots[[1]]) } else { #
> Set up the page grid.newpage() pushViewport(viewport(layout =
> grid.layout(nrow(layout), ncol(layout)))) # Make each plot, in the correct
> location for (i in 1:numPlots) { # Get the i,j matrix positions of the
> regions that contain this subplot matchidx <- as.data.frame(which(layout ==
> i, arr.ind = TRUE)) print(plots[[i]], vp = viewport(layout.pos.row =
> matchidx$row, layout.pos.col = matchidx$col)) } } }
>
>     [[alternative HTML version deleted]]

What part of NO HTML don't you understand????

Read the .... posting guide:
> PLEASE do read the posting guide http://www.R-project.org/posting-guide.html
> and provide commented, minimal, self-contained, reproducible code.

David Winsemius
Alameda, CA, USA


------------------------------

Message: 25
Date: Fri, 15 Jan 2016 17:24:11 +1100
From: Jim Lemon <drjimle...@gmail.com>
To: jpm miao <miao...@gmail.com>, r-help mailing list
    <r-help@r-project.org>
Subject: Re: [R] How can we let "multiplot.R" return a plot?
Message-ID:
    <ca+8x3fuclethu8dsdgnurcdbanjyeqfhtnsz_t-wqpj0pqk...@mail.gmail.com>
Content-Type: text/plain; charset="UTF-8"

Hi Miao,
If I understand your question correctly, you want to get a return value
from the "multiplot" function that you have copied into your message. You
could simply add:

return(plotlist)

just before the final right brace in the function and it would return the
list of plots that you have created. However, as you already have this, I
think you probably want to get a single plot object that has all the
information in the original plotlist. This doesn't seem possible to me as I
don't think that the ggplot objects can be merged. I may be mistaken, so I
will defer to anyone more knowledgeable.

Jim

On Fri, Jan 15, 2016 at 4:26 PM, jpm miao <miao...@gmail.com> wrote:

> Hi,
>
>    The function "ggplot" does plot and return a plot. For example, we can
> write:
>
> y = ggplot(.. .....)  Then y is  a plot.
>
>    How can we modify the multiplot function so that it can also return a
> plot?  Multiplot.R is here:
>
>    http://www.cookbook-r.com/Graphs/Multiple_graphs_on_one_page_(ggplot2)/
> ,
> and the code is as below.
>
[[elided Yahoo spam]]
>
>    Thanks,
>
> Miao
>
> # Multiple plot function # # ggplot objects can be passed in ..., or to
> plotlist (as a list of ggplot objects) # - cols: Number of columns in
> layout #
> - layout: A matrix specifying the layout. If present, 'cols' is ignored. #
> #
> If the layout is something like matrix(c(1,2,3,3), nrow=2, byrow=TRUE), #
> then plot 1 will go in the upper left, 2 will go in the upper right, and #
> 3 will go all the way across the bottom. # multiplot <- function(...,
> plotlist=NULL, file, cols=1, layout=NULL) { library(grid) # Make a list
> from the ... arguments and plotlist plots <- c(list(...), plotlist)
> numPlots = length(plots) # If layout is NULL, then use 'cols' to determine
> layout if (is.null(layout)) { # Make the panel # ncol: Number of columns of
> plots # nrow: Number of rows needed, calculated from # of cols layout <-
> matrix(seq(1, cols * ceiling(numPlots/cols)), ncol = cols, nrow =
> ceiling(numPlots/cols)) } if (numPlots==1) { print(plots[[1]]) } else { #
> Set up the page grid.newpage() pushViewport(viewport(layout =
> grid.layout(nrow(layout), ncol(layout)))) # Make each plot, in the correct
> location for (i in 1:numPlots) { # Get the i,j matrix positions of the
> regions that contain this subplot matchidx <- as.data.frame(which(layout ==
> i, arr.ind = TRUE)) print(plots[[i]], vp = viewport(layout.pos.row =
> matchidx$row, layout.pos.col = matchidx$col)) } } }
>
>        [[alternative HTML version deleted]]
>
> ______________________________________________
> R-help@r-project.org mailing list -- To UNSUBSCRIBE and more, see
> https://stat.ethz.ch/mailman/listinfo/r-help
> PLEASE do read the posting guide
> http://www.R-project.org/posting-guide.html
> and provide commented, minimal, self-contained, reproducible code.
>

    [[alternative HTML version deleted]]


------------------------------

Message: 26
Date: Fri, 15 Jan 2016 10:41:18 +0000
From: Peter Crowther <peter.crowt...@melandra.com>
To: R list <r-help@r-project.org>
Subject: [R] R 3.2.3 on Windows 8.1 with interface scaling: how do I
    produce metafiles that fill the whole canvas?
Message-ID:
    <CALhdq6uebO=zdmusodho-qbnjevsbkyb9lw0d2hyvc1zgkh...@mail.gmail.com>
Content-Type: text/plain; charset=UTF-8

To reproduce (requires Windows):

1) Set your desktop scaling to 100%;
2) run the script below;
3) observe that the chart in scaled-example.wmf takes up the whole canvas.
4) Set your desktop scaling to greater than 100% (try 150% or 200%);
5) again run the script below;
6) observe that the chart in scaled-example.wmf takes up less than the
whole canvas.

Increasingly, we're seeing users run R on machines with very
high-resolution screens and scaled displays.  How can we correct for
this effect within R?

Cheers,

- Peter

Script:

-- start --
egfr <- c(222.6,176.4)
outcome <- data.frame(egfr)
hgb <- c(141,134)
predictors <- data.frame(hgb)
title <- "eGFR vs. Hgb"
ylab <- "eGFR"
xlab <- "Hgb"
gr1<-file.path(path.expand('~'),"scaled-example.wmf")
win.metafile(gr1)
plot(predictors[[1]],outcome[[1]],main=title,ylab=ylab,xlab=xlab)
dev.off()
-- end --


------------------------------

Subject: Digest Footer

_______________________________________________
R-help@r-project.org mailing list
https://stat.ethz.ch/mailman/listinfo/r-help
PLEASE do read the posting guide http://www.R-project.org/posting-guide.html
and provide commented, minimal, self-contained, reproducible code.

------------------------------

End of R-help Digest, Vol 155, Issue 15
***************************************


        [[alternative HTML version deleted]]

______________________________________________
R-help@r-project.org mailing list -- To UNSUBSCRIBE and more, see
https://stat.ethz.ch/mailman/listinfo/r-help
PLEASE do read the posting guide http://www.R-project.org/posting-guide.html
and provide commented, minimal, self-contained, reproducible code.
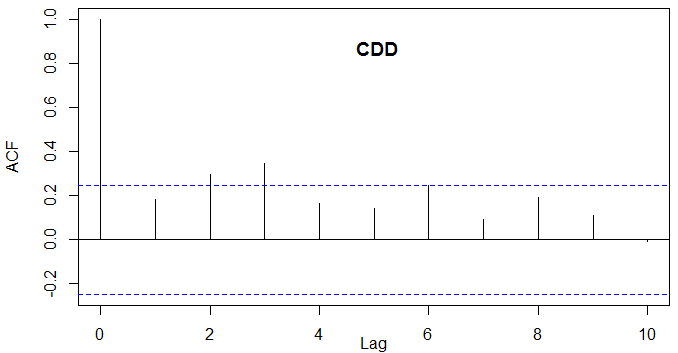