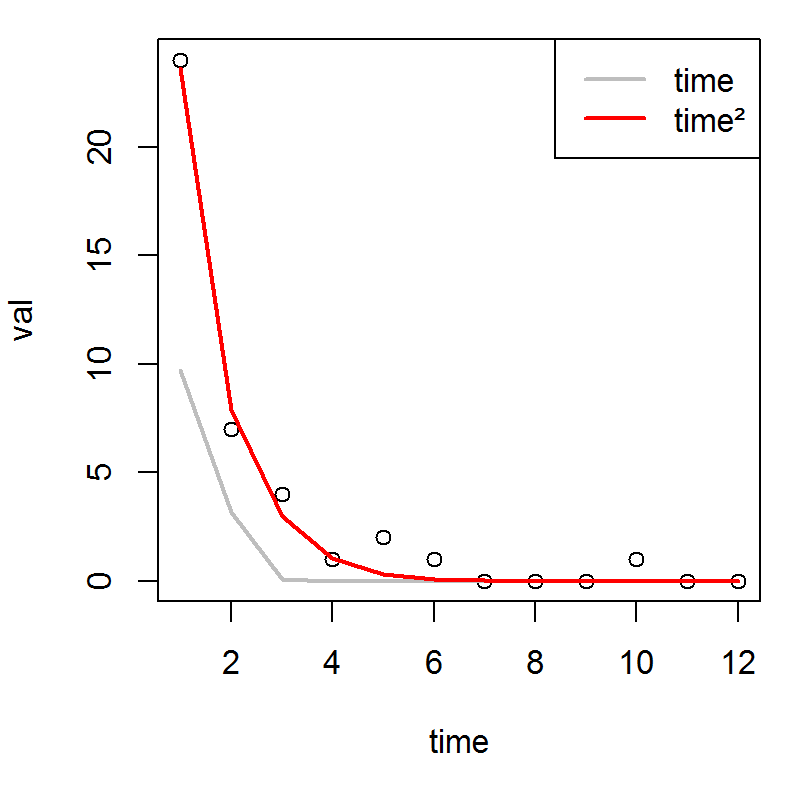
val_w_time <- data.frame(time = 1:12,
    val = c(24,7,4,1,2,1,0,0,0,1,0,0))

fitdistr(val_w_time$val,"gamma")
# Error in optim(x = c(24, 7, 4, 1, 2, 1, 0, 0, 0, 1, 0, 0), par = list( :
#   initial value in 'vmmin' is not finite

# this error message doesn't necessarily mean that it
# won't fit the distribution; just that it can't.

# fitdistr is usually used to fit data to a distribution,
# rather than data representing the shape of a distribution
# to that distribution.


plot(val_w_time)

g1 <- nls(histd ~ dgamma(time/12, shape = gamma, rate = theta), data =
val_w_time,
    start = list(gamma = 0.5, theta = 4),
    trace = TRUE)
# 495.188 :  0.5 4.0
# 250.5561 :   5.943122 54.029829
# 241.5951 :  11.20099 98.36401
# Error in numericDeriv(form[[3L]], names(ind), env) :
#   Missing value or an infinity produced when evaluating the model
# In addition: Warning message:
# In dgamma(time/12, shape = gamma, rate = theta) : NaNs produced

# okay, so we don't get convergence with nls

lines(val_w_time$time,
    dgamma((1:12)/12, shape = 11.20099, rate = 98.36401), col = "grey", lwd =
2)

# but we're basically fitting to 3 data points

# but we can mess around with the x axis

g2 <- nls(histd ~ dgamma((time/12)^2, shape = gamma, rate = theta), data =
val_w_time,
    start = list(gamma = 0.5, theta = 4),
    trace = TRUE)

with(val_w_time, lines(time,
    predict(g2), col = "red", lwd = 2))

# so that the distribution looks more like the data

http://i1277.photobucket.com/albums/y496/CSJCampbell/armel_data_gamma_zpsbb0146ee.png

# hopefully this gives you some ideas
Chris Campbell, PhD
Tel. +44 (0) 1249 705 450 | Mobile. +44 (0) 7929 628349
mailto:ccampb...@mango-solutions.com | http://www.mango-solutions.com
Mango Solutions, 2 Methuen Park,  Chippenham, Wiltshire , SN14 OGB UK

-----Original Message-----
From: r-help-boun...@r-project.org [mailto:r-help-boun...@r-project.org] On
Behalf Of Kaptue Tchuente, Armel
Sent: 12 June 2013 20:22
To: r-help@r-project.org
Subject: [R] How to fit the cumulative probability distributive functiion with
the gamma distribution?

Hello everyone,


I'm trying to fit the PDF of time series datasets with the gamma distribution.

Nonetheless, this isn't possible for several datasets since the gamma
distribution can only been used to fit continuous distribution. For instance,
gam<-fitdrib(hist<-c(24,7,4,1,2,1,0,0,0,1,0,0),"gamma") will yield an error
message.

To solve this issue, I decided to fit the cumulative distributive function i.e.
gam<-fitdistr(hist_cum<-c(24,31,35,36,38,39,39,39,40,40,40)).

Now I don't know how to obtain the corresponding CDF of the gamma distribution
which will fit the empirical CDF.

I have already tried some instructions like pgamma(seq(4,4*12,4),
scale=1/gam$estimate[2],shape=gam$estimate[1]) without success as you can see
on this picture
https://docs.google.com/file/d/0BwjZP-sfazLMaDM2bHBDYnFOSWs/edit?usp=sharing
where the curve in blue was supposed to be the fitted gamma CDF.

I said "was supposed" because I was obliged to use the instruction par(new=T)
in order to super-impose the fitted gamma CDF


Cheers


Armel


        [[alternative HTML version deleted]]

______________________________________________
R-help@r-project.org mailing list
https://stat.ethz.ch/mailman/listinfo/r-help
PLEASE do read the posting guide http://www.R-project.org/posting-guide.html
and provide commented, minimal, self-contained, reproducible code.

--

LEGAL NOTICE\ \ This message is intended for the use of ...{{dropped:18}}

______________________________________________
R-help@r-project.org mailing list
https://stat.ethz.ch/mailman/listinfo/r-help
PLEASE do read the posting guide http://www.R-project.org/posting-guide.html
and provide commented, minimal, self-contained, reproducible code.