On Feb 10, 2013, at 11:36 PM, zhu yao wrote:
Dear R-users
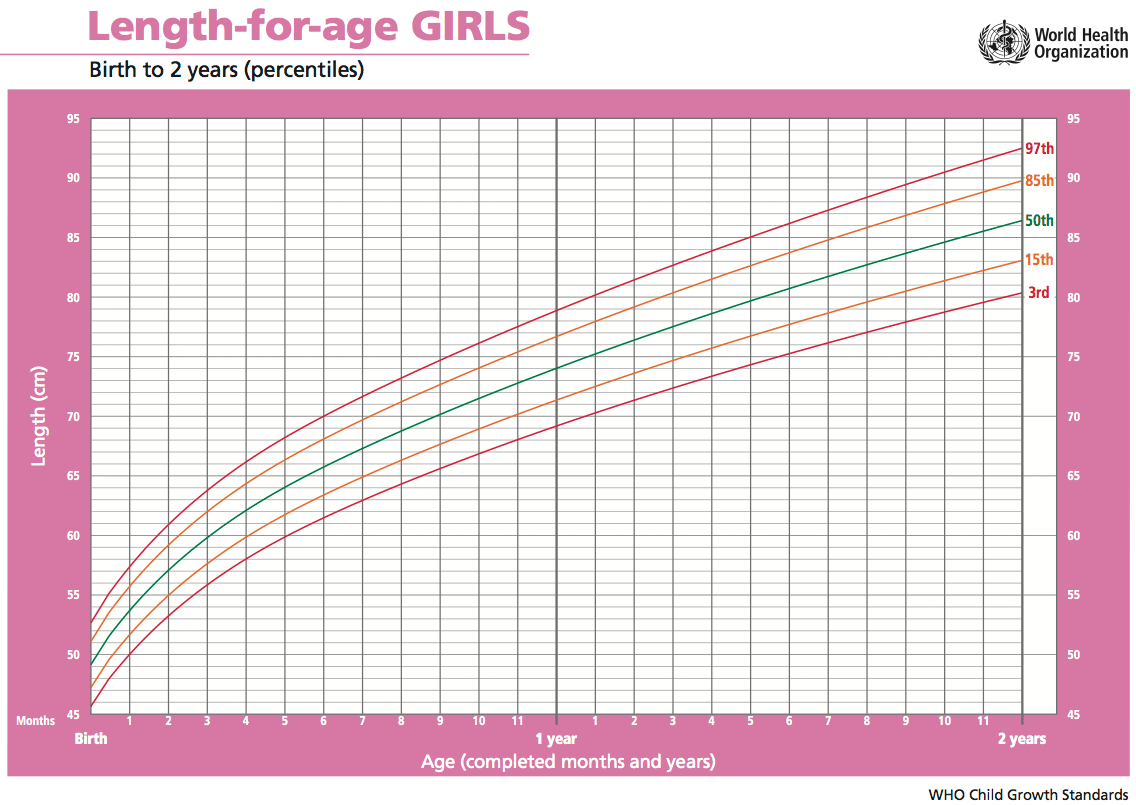
I want to generate a growth chart like this:
http://php.med.unsw.edu.au/embryology/images/9/9a/WHO-XX_length_birth_to_2_years.png
can you give some suggestions about the functions I should use?
Looking first at:

http://www.who.int/entity/childgrowth/standards/Chap_2.pdf

ANd then doing a simple search:

> require(sos)
Loading required package: sos
Loading required package: brew

Attaching package: ‘sos’

The following object(s) are masked from ‘package:utils’:

    ?

> findFn("LMS method")
found 83 matches;  retrieving 5 pages
2 3 4 5
Downloaded 76 links in 32 packages.
I beleive the LMS quantile method in the VGAM package is the same as
used by WHO.
--
David
Thanks

*Yao Zhu*
*Department of Urology
Fudan University Shanghai Cancer Center
Shanghai, China*

        [[alternative HTML version deleted]]

______________________________________________
R-help@r-project.org mailing list
https://stat.ethz.ch/mailman/listinfo/r-help
PLEASE do read the posting guide http://www.R-project.org/posting-guide.html
and provide commented, minimal, self-contained, reproducible code.
David Winsemius, MD
Alameda, CA, USA

______________________________________________
R-help@r-project.org mailing list
https://stat.ethz.ch/mailman/listinfo/r-help
PLEASE do read the posting guide http://www.R-project.org/posting-guide.html
and provide commented, minimal, self-contained, reproducible code.