On 12-09-11 2:40 PM, Lukas Kohl wrote:
dear R gurus,
I repeatedly run into this problem, maybe there's an easy way to solve it.
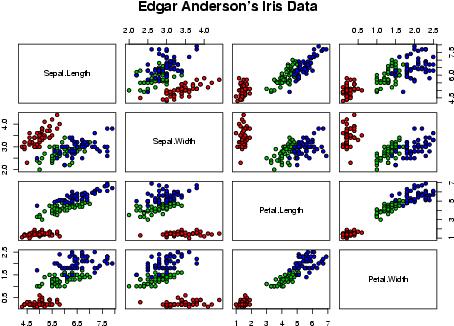
I want a composite plot with multiple graphs that share the same axis,
similar way as done by the pairs() (eg. like this here
http://www.r-project.org/screenshots/iris-pairs.jpg). all plot panels
shall have the same size, but there need to be extra space at the
outside of the whole graphic to label the axis. space between the
panels should be minimal.
I tried to set par(mar) to low levels, and add additional space with
par(oma) for axis&tick labels, however, the individual plots can't
draw into the oma space - is there an alternative way?
pairs.default is written in R; you could read the code and do what it
does. (It does it by calling the Axis function with xpd=NA. See ?par
for what this means.)
Duncan Murdoch
thanks a lot,
  lukas

This electronic communication is governed by the terms and conditions at
http://www.mun.ca/cc/policies/electronic_communications_disclaimer_2012.php

______________________________________________
R-help@r-project.org mailing list
https://stat.ethz.ch/mailman/listinfo/r-help
PLEASE do read the posting guide http://www.R-project.org/posting-guide.html
and provide commented, minimal, self-contained, reproducible code.
______________________________________________
R-help@r-project.org mailing list
https://stat.ethz.ch/mailman/listinfo/r-help
PLEASE do read the posting guide http://www.R-project.org/posting-guide.html
and provide commented, minimal, self-contained, reproducible code.