Another possibility for visual display of several kinds of data is RCytoscape,
for which an example can be seen here:
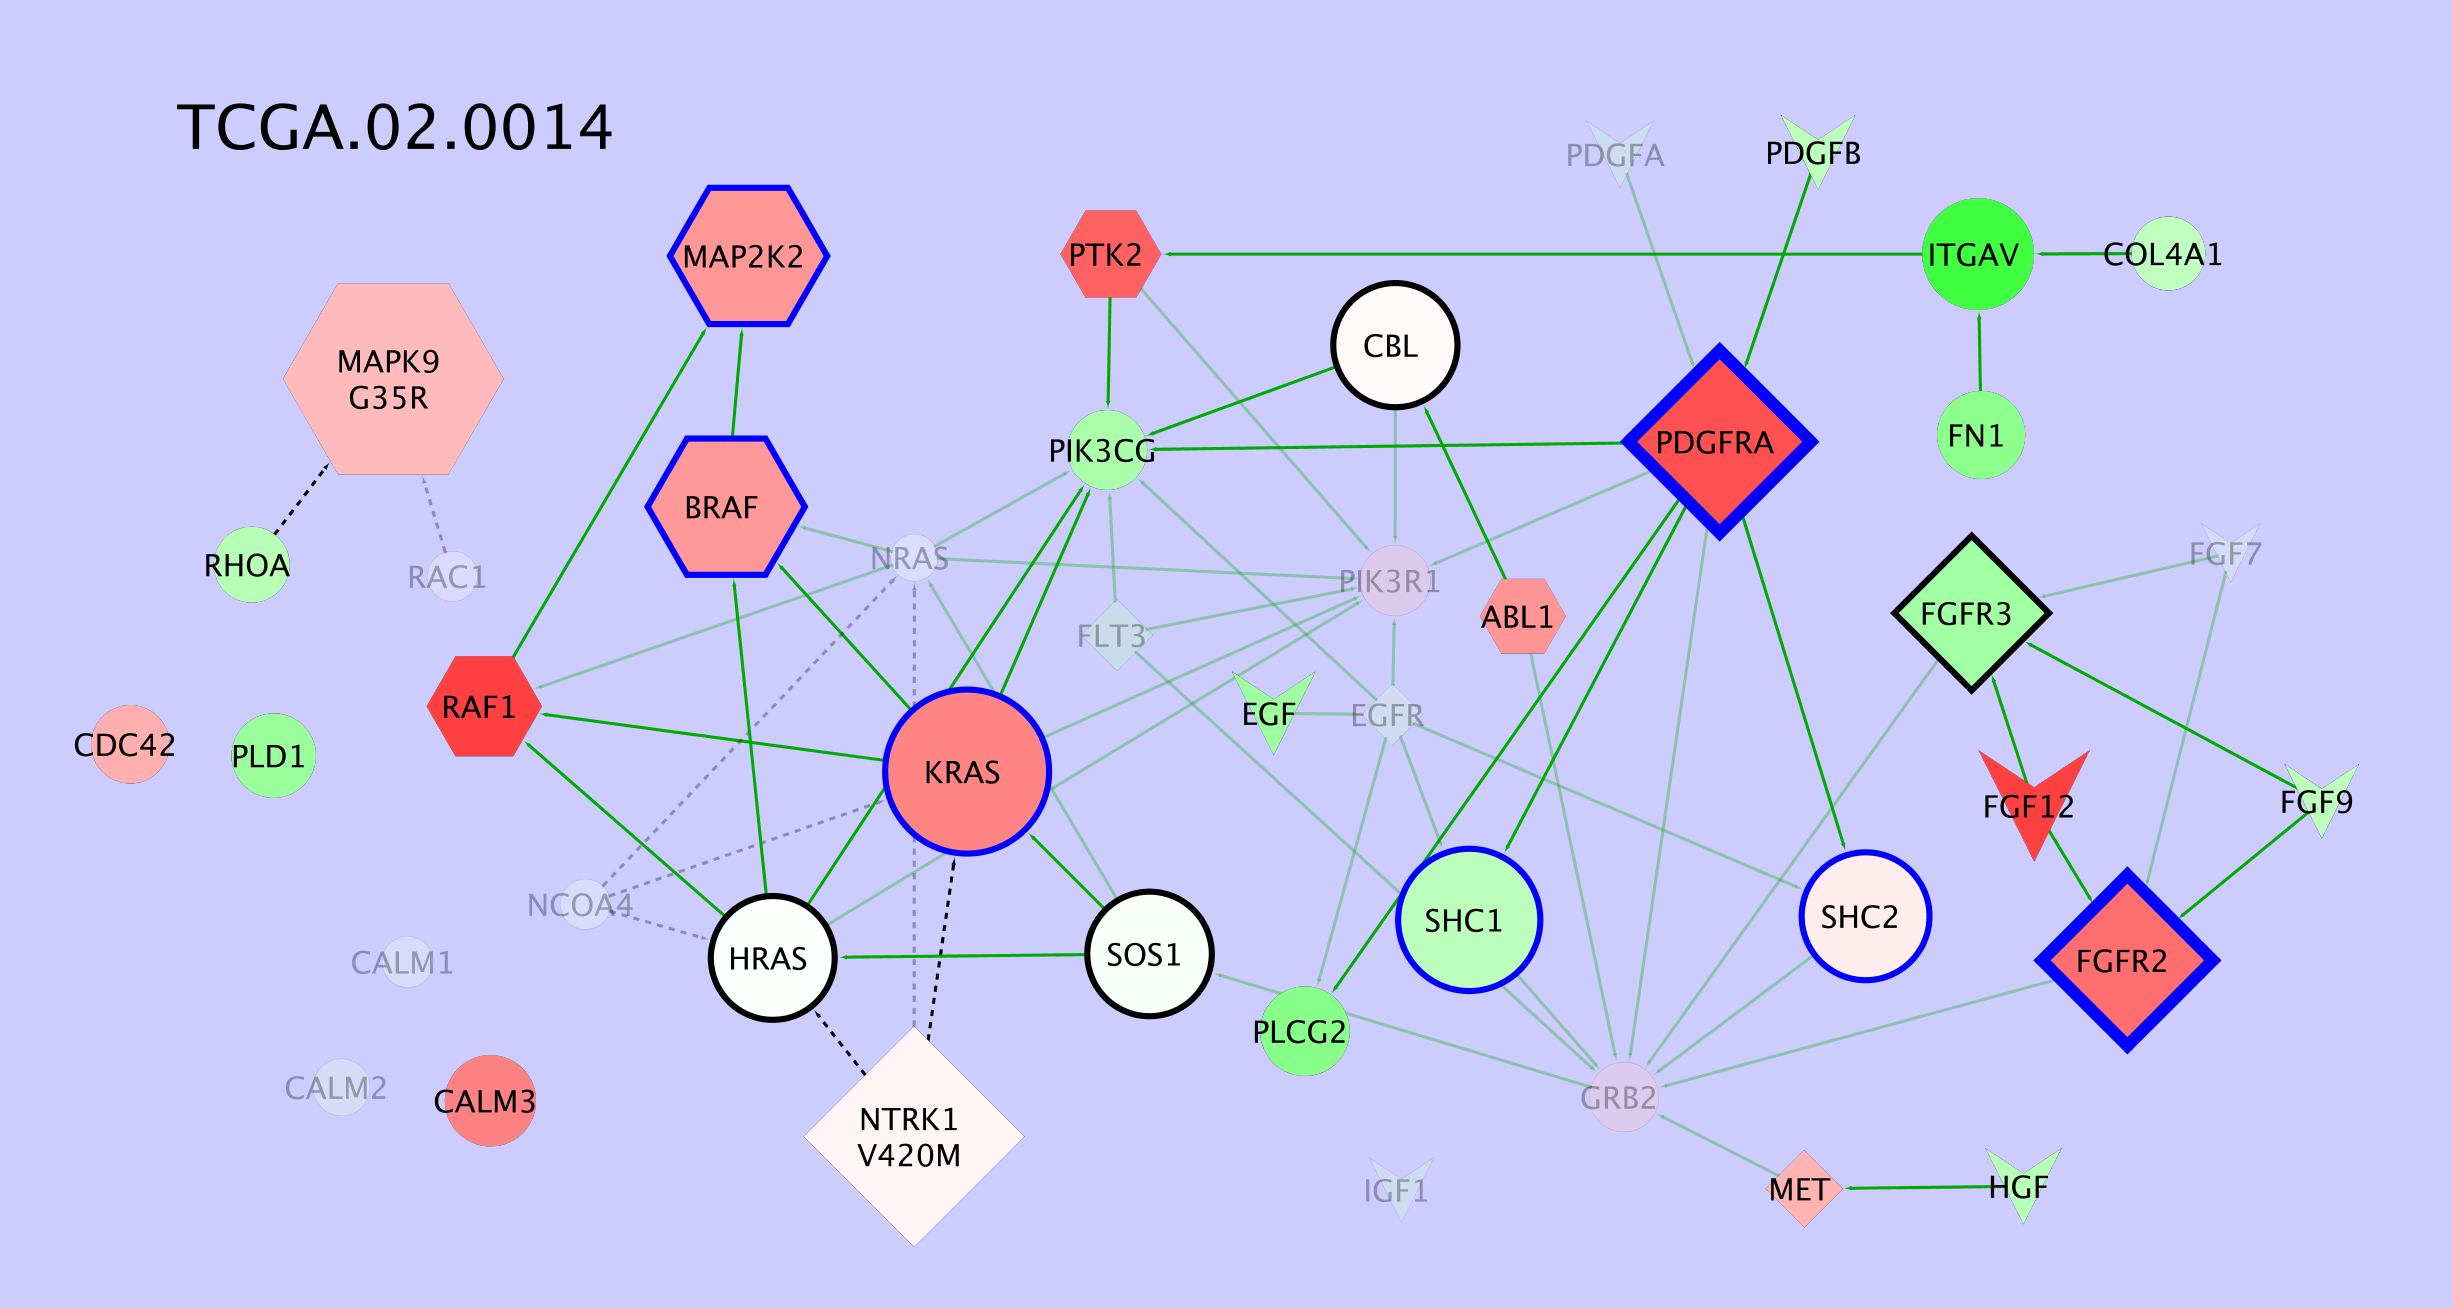
http://rcytoscape.systemsbiology.net/versions/current/gallery/TCGA/subnet.TCGA.02.0014.png

This portrays
  1) gene expression (green: under-expression; red: over-expression)
  2) copy number (blue: high, black: low)
  3) gene type (node shape: hexagons are kinases, arrows are ligands, diamonds
are receptors, circles for everything else)
  4) mutation status (not SNPs, but non-synonymous amino acid substitutions)
  5) in the context of gene relationships, from KEGG

A vignette for a larger version of this network is nearly complete.  The
Cytoscape network map is created from data and R code.

 - Paul

On Apr 23, 2012, at 5:15 AM, Steve Lianoglou wrote:

> Hi,
>
> On Mon, Apr 23, 2012 at 7:33 AM, Ekta Jain <ekta_j...@jubilantbiosys.com>
> wrote:
>> Hello,
>> Can anyone please suggest any packages in R that can be used to overlay gene
>> expression data on SNP (affymetrix) copy number ?
>
> I guess you mean visually? If so, I'd suggest skimming through the
> vignettes of the following packages to see which one might suit you
> best:
>
> * Gviz
> * ggbio
> * GenomeGraphs
>
> -steve
>
> --
> Steve Lianoglou
> Graduate Student: Computational Systems Biology
>  | Memorial Sloan-Kettering Cancer Center
>  | Weill Medical College of Cornell University
> Contact Info: http://cbio.mskcc.org/~lianos/contact
>
> _______________________________________________
> Bioconductor mailing list
> bioconduc...@r-project.org
> https://stat.ethz.ch/mailman/listinfo/bioconductor
> Search the archives:
> http://news.gmane.org/gmane.science.biology.informatics.conductor

______________________________________________
R-help@r-project.org mailing list
https://stat.ethz.ch/mailman/listinfo/r-help
PLEASE do read the posting guide http://www.R-project.org/posting-guide.html
and provide commented, minimal, self-contained, reproducible code.