Hi:

As a statistician and long time baseball addict, I concur wholeheartedly
with David that:
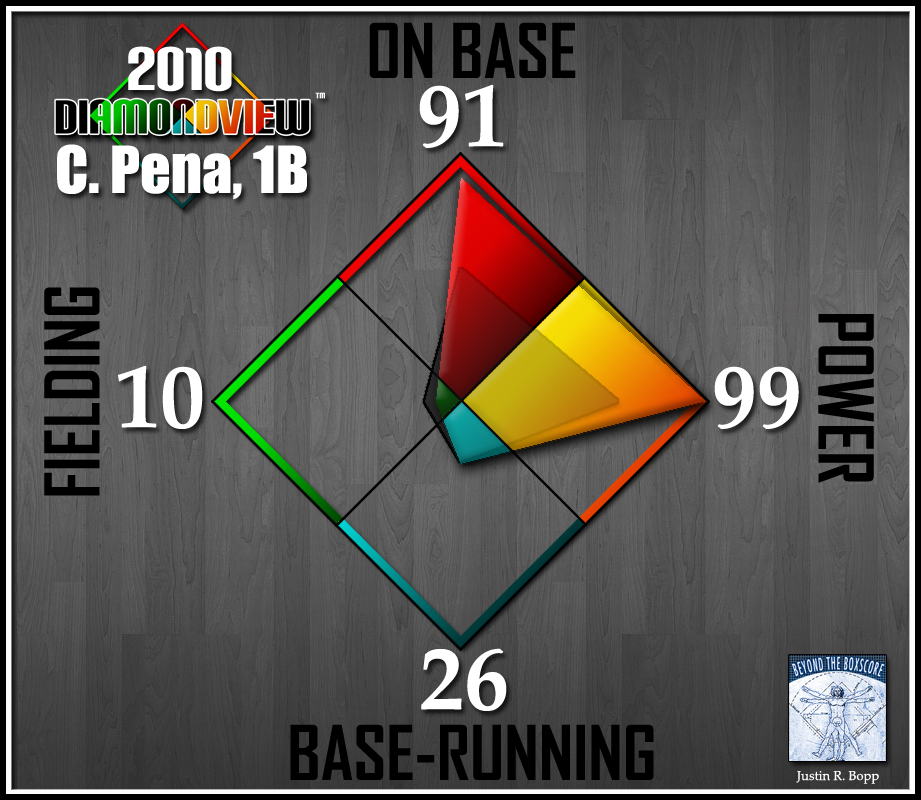
..."you've got to admit that was one gawdawful graph".

Firstly, the areas are not proportional to the values; this is a common
graphics mistake. (For example, compare baserunning to power - is the area
of the former about 1/4 the area of the latter, or is it closer to 1/16?)
Secondly, it is riddled with chartjunk. Thirdly, a simple multivariate
graphic called a star plot (aka spider plot, radar plot) does this very
simply (and more accurately). Moreover, a star plot is commonly constructed
with several  individuals (e.g., teammates or comparable players) so that
one can compare them on multiple characteristics simultaneously. Fourthly,
what are the numbers supposed to represent? Percentiles? Indices scaled to a
maximum of 100? Something else?? Finally, it uses color, large fonts and
advertising to compensate for low-information data. I'm sure the marketing
guys love it, though :)  Poor Carlos...I'm sure he feels his fielding and
baserunning deserve more props...

If you're interested in doing graphics with some professionalism, start by
looking into the books, publications and websites of Edward Tufte and
William Cleveland. Both have had a profound influence on developments in
statistical graphics over the past three decades, much of which is
implemented (and extended) in several of the graphics packages in R (viz.,
grid, lattice and ggplot2). A common basic theme espoused by both is to
produce graphics with a high 'information-to-ink' ratio. I think we can
agree that the graphic you put up does not meet that desideratum.

HTH,
Dennis


On Wed, Sep 1, 2010 at 4:50 PM, John K. Williams <sabesin2...@gmail.com>wrote:

> Hi, does anyone have any idea how I might make a plot in R similar to this:
> http://assets.sbnation.com/assets/272612/BATTER-1B-PENA.png
>
> Specifically looking to plot 3 numbers in a triangle like that.
>
>        [[alternative HTML version deleted]]
>
> ______________________________________________
> R-help@r-project.org mailing list
> https://stat.ethz.ch/mailman/listinfo/r-help
> PLEASE do read the posting guide
> http://www.R-project.org/posting-guide.html
> and provide commented, minimal, self-contained, reproducible code.
>

        [[alternative HTML version deleted]]

______________________________________________
R-help@r-project.org mailing list
https://stat.ethz.ch/mailman/listinfo/r-help
PLEASE do read the posting guide http://www.R-project.org/posting-guide.html
and provide commented, minimal, self-contained, reproducible code.