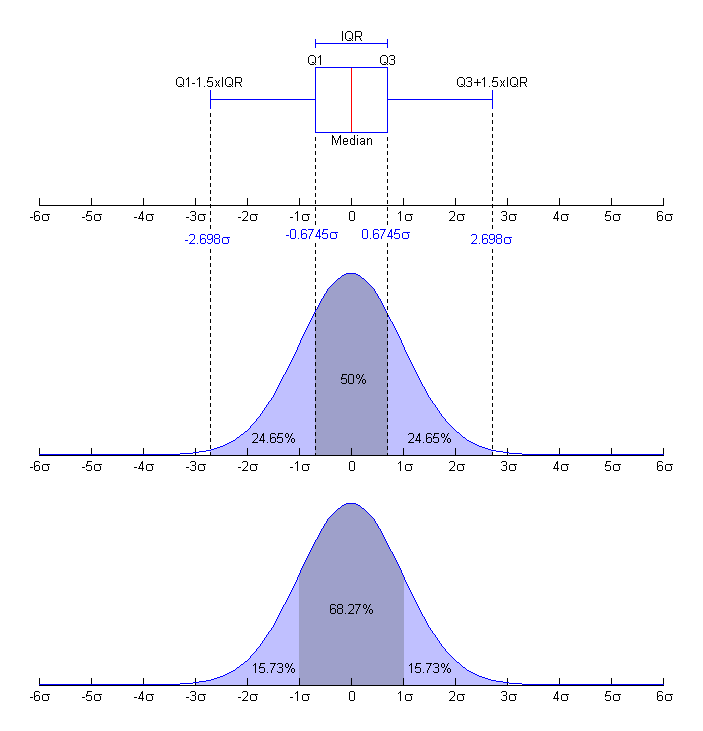
On Saturday 14 August 2010 23:08:31 Peter Dalgaard wrote:
> Johannes Graumann wrote:
> > Hi,
> >
> > can someone point me at material to understand how in
> > http://upload.wikimedia.org/wikipedia/commons/8/89/Boxplot_vs_PDF.png the
> > "fivenum"-corresponding percentages might be calculated?
>
> Looks like a pretty straightforward application of pnorm() and qnorm().
>
> pnorm(4*qnorm(.75), lower=F) # Q3 + 1.5 IQR = 4 Q3 since IQR = 2 Q3
>
> [1] 0.003488302
>
> gives the tail probabilities of .35%, and the rest is by definition.
Thanks a lot!

Joh
![]() signature.asc
signature.asc
Description: This is a digitally signed message part.
______________________________________________
R-help@r-project.org mailing list
https://stat.ethz.ch/mailman/listinfo/r-help
PLEASE do read the posting guide http://www.R-project.org/posting-guide.html
and provide commented, minimal, self-contained, reproducible code.