Hi everyone,

I’m sending this email to present myself and a project that I’m planning to
submit to QEMU/GSoC this year. As I see that this project could result in
useful improvements and tools to the community, I would love to have
feedback from the community and perhaps make it even more useful.
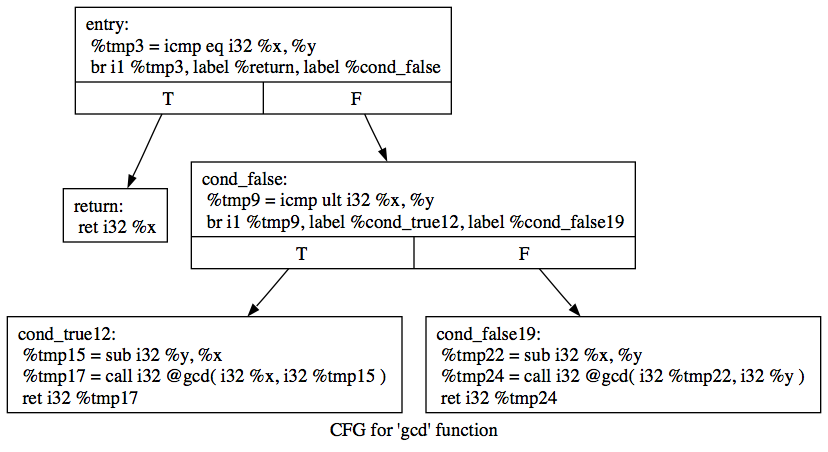
-----------------------------------------------------------------------------

So, before I start, I would like to present myself:

I'm Vanderson Martins do Rosario, a Ph.D. candidate in Computer Science at
Unicamp in Campinas, Brazil.

Motivations to GSOC:  My first contact with the Free and Open Source
movement was through a neighbor of mine back when I was in high-school
(2009) and since then I have been using free software daily, became a
regular user of GNU/Linux and graduated in Computer Science (2016). My main
contributions to the FOSS community was related only to organizing events
(FLISOL) and founding a Hackerspace in my city helping to spread free
software philosophy. However, I have not yet had the chance to contribute
in code for main FOSS projects (only a few LLVM commits), initially because
I did not have the skills necessary and then because I did not have time.
Today I am a Ph.D. candidate in Computer Science working with JIT compilers
and Dynamic Binary Translation and when I saw QEMU in GSoC, I realize that
now I have the knowledge (it is what I have been working in my Ph.D.) and
also the time (as I have already finished all my classes and obligations).
Thus, I thought that this would be a great opportunity to finally
contribute to the community with code.
Technically, I will not be on vacation during the GSoC because in my Ph.D.
program there is not such a thing, but my advisor agreed that this will be
a great opportunity for me and, as it is related to my thesis theme, he
gave me permission to only work and focus on GSoC  during the necessary
period.

Experience and Contributions: I have experience with Dynamic Compilers and
Compilers in general. I have already done an internship as Compiler
Engineer at MATERA Systems and I have worked in a research project with the
Android JIT compiler (ART) at Samsung Brazil.
I am proficient in C, modern C++, and Python. I also have experience
working with x86, ARM, MIPS, and RISC-V assembly.

Some of my relevant projects:
- OI-DBT: A Dynamic Binary Translator for a research ISA named OpenISA that
uses the LLVM to generate optimized translations to x86 and ARM.
https://github.com/OpenISA/oi-dbt
- Custom RISC-V Tracer: I changed RV-8 RISC-V emulator to dump execution
traces and others execution information in a unique gzip file.
https://github.com/vandersonmr/custom-riscv-tracer
- RAIn: A DBT simulator that uses traces from the Custom RISC-V Tracer to
test new proposed DBT’s configurations. https://github.com/vandersonmr/Rain3
- RISC-V SBT: A RISC-V LLVM-based Static Binary Translator which I have
helped building https://github.com/OpenISA/riscv-sbt

-----------------------------------------------------------------------------

Project: Improving Measurement of Tiny Code Generation Quality.
Mentor: Alex Bennée

I/ Introduction

In most applications, the majority of the execution time is spent in a very
small portion of code. Regions of a code which have high-frequency
execution are called hot while all other regions are called cold. As a
direct consequence, emulators also spent most of their execution time
emulating these hot regions and, so, dynamic compilers and translators need
to pay extra attention to them. To guarantee that these hot regions are
compiled/translated generating high-quality code is fundamental to achieve
a final high-performance emulation. Thus, one of the most important steps
in tuning an emulator performance is to identify which are the hot regions
and to measure their translation quality.

QEMU is not different and it offers the ‘-d’ options which can dump the
imputed assembly (guest binary) with ‘-d in_asm’, the generated TCG
Intermediate Representation (IR, TCG ops)  with ‘-d op_opt‘ and the final
host assembly (target binary) with ‘-d out_asm’. So, one could use these
dumps to analyze the quality of the translations, but in practice, these
options generate a huge amount of data and, therefore, doing this analyze
by hand can easily become infeasible. The ‘-dfilter’ can be used to specify
a range of address to filter the dump, so we could use it to only dump
information for the hot Translated Blocks (TB). However, in QEMU,
currently, there is also no easy way to identify hot TBs. We could use the
‘-d exec’ information to reconstruct the emulation frequency and identify
the hot TBs, but, once again, it is not trivial to do so as it generates
lots of raw information.

Having in mind the importance of detecting and inspecting hot regions of
code and giving the lack of tools to do so in QEMU, we propose in this
project the enhance of QEMU log system to add these capabilities. Our plan
is to add three new capabilities to QEMU: (1) to profile and list hot
emulated blocks, (2) to calculate global and per block translation quality
statistics, and (3) to allow all these inspections to be done in an
interactive mode in the monitor tool.

All three proposed enhances are follow described:

 1 - Identify Hot TBs:
       A - Profile the emulation process to add the possibility of listing
the TBs ordered  by their execution frequency;
       B - Add an option to show the execution flow graph of the TBs with
colors indicating execution frequency (using graphviz); an example of a CFG
exported by Clang using graphviz can be seen in Figure 1 (
https://releases.llvm.org/2.2/docs/tutorial/JITTutorial2-1.png).
       C - Add an option to list only the TBs necessary to cover 90% of the
execution frequency (90% cover set);
       D - Elide and beautify common blocks like softmmu access macros in
the flow graph and in the log;
       E - As perf has only access to the addresses in the QEMU binary, it
cannot resolve the addresses on the dynamically compiled TBs. So, we plan
to add an option to output a jitdump file, mapping TBs memory address
during emulation with the original entrance guest addresses. In DBT which I
am working in my Ph.D. (oi-dbt), I have implemented a similar feature but
using ‘/tmp/perf-pid.map’. The result with oi-dbt is exemplified in Figure
2 (https://imgur.com/a/7JJ7v2R). A similar result could be achieved with
qemu.

2 - Translation Quality Statistics:
       A - Add options to show the number of fills/spills during
translation on average and for each block;
       B - Add options to show the guest/host instructions proportion on
average and for each block.

3 - Dynamic Inspection Using Monitor:
       A - Add the support for interactive exploration of translation state
by allowing the collection of information and statistics from items 1 and 2
while in the monitor tool. A simple proof of concept of the idea was
proposed in one patch from Alex Bennée:
http://patches.linaro.org/patch/113269/.

II/ Schedule

In the following schedule (Table 1), the tasks 1, 2, 3 and 5 are related to
the first enhance (Identify Hot TBs), the task 4 is related to the second
(Translation Quality Statistics) and the task 6 with the third (Dynamic
Inspection Using Monitor).

|--------------------------|---|---|---|---|---|---|---|---|---|----|----|----|

| Task \ Week              | 1 | 2 | 3 | 4 | 5 | 6 | 7 | 8 | 9 | 10 | 11 |
12 |
|--------------------------|---|---|---|---|---|---|---|---|---|----|----|----|
| 1-Study QEMU code and    | X | X |   |   |   |   |   |   |   |    |
|    |
|   plan modifications.    | X | X |   |   |   |   |   |   |   |    |
|    |
|--------------------------|---|---|---|---|---|---|---|---|---|----|----|----|
| 2-Implement a mechanism  |   |   | X | X | X |   |   |   |   |    |
|    |
|   to profile the TBs     |   |   | X | X | X |   |   |   |   |    |
|    |
|   execution.             |   |   | X | X | X |   |   |   |   |    |
|    |
|--------------------------|---|---|---|---|---|---|---|---|---|----|----|----|

| 3-Use the profile        |   |   |   |   | X | X |   |   |   |    |
|    |
|   information to add new |   |   |   |   | X | X |   |   |   |    |
|    |
|   options when dumping   |   |   |   |   | X | X |   |   |   |    |
|    |
|   TBs (90% cover set,...)|   |   |   |   | X | X |   |   |   |    |
|    |
|--------------------------|---|---|---|---|---|---|---|---|---|----|----|----|

| 4-Implement a way to     |   |   |   |   |   |   | X |   |   |    |
|    |
|   collect translation    |   |   |   |   |   |   | X |   |   |    |
|    |
|   quality measurements   |   |   |   |   |   |   | X |   |   |    |
|    |
|   from the TBs and add   |   |   |   |   |   |   | X |   |   |    |
|    |
|   the new informations   |   |   |   |   |   |   | X |   |   |    |
|    |
|   into the logs.         |   |   |   |   |   |   | X |   |   |    |
|    |
|--------------------------|---|---|---|---|---|---|---|---|---|----|----|----|

| 5-Implement the option of|   |   |   |   |   |   |   | X | X |    |
|    |
|   generating a visual    |   |   |   |   |   |   |   | X | X |    |
|    |
|   dump of the information|  |   |   |   |   |   |   | X | X |    |
|    |
|   from tasks 3 and 4     |  |   |   |   |   |   |   | X | X |    |
|    |
|   using graphviz.        |   |   |   |   |   |   |   | X | X |    |
|    |
|--------------------------|---|---|---|---|---|---|---|---|---|----|----|----|

| 6-Integrate itens 3, 4   |   |   |   |   |   |   |   |   | X | X  | X  |
X  |
|   and 5 into the monitor |   |   |   |   |   |   |   |   | X | X  | X  |
X  |
|   tool.                  |   |   |   |   |   |   |   |   | X | X  | X  |
X  |
|--------------------------|---|---|---|---|---|---|---|---|---|----|----|----|

-----------------------------------------------------------------------------

That is all folks!
Thank you very much!
--
Vanderson M. Rosario
https://vandersonmr.github.io/