Hello,

I'm sending this email for asking about the work in integrating OSprofiler into
Aodh & Panko.
Currently, there are some patches related to this work, and they are waiting
for review:
    1. Aodh: https://review.openstack.org/#/c/483268/
    2. Aodh client: https://review.openstack.org/#/c/484295/
    3. Panko: https://review.openstack.org/#/c/483848/
    4. Panko client: https://review.openstack.org/#/c/484294/
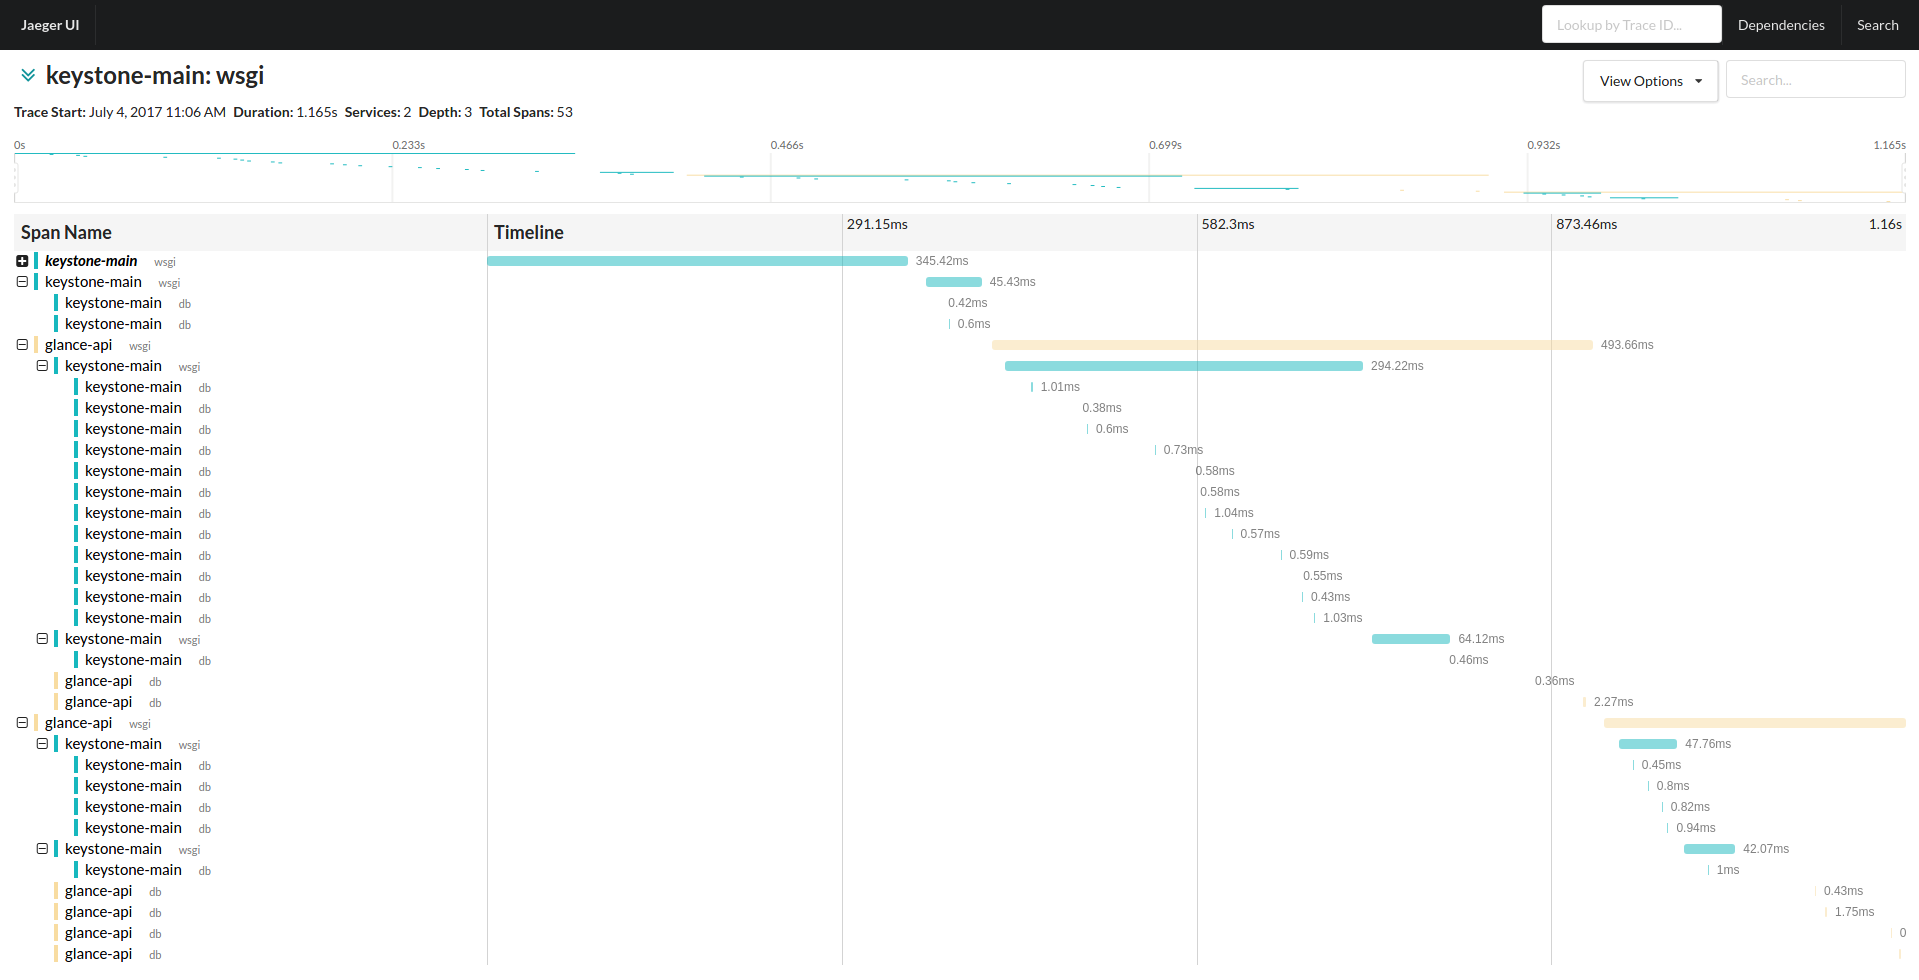
FYI, OSprofiler provides functionality to generate a trace per request, that
goes through all involve services.
This trace can visualize flow of a request [1] [2].
A trace from OSprofiler can help us know these things:
    - Performance bottle-neck of a service
    - Trouble-shooting issue in a service
    - Understanding flow of a request (from cli client or other client)
    - Trace can be store in persistent storage
    - Visualization trace flow in many OpenTracing compatible tracer [2] (will
be done soon)
    - Head, tail-based sampling for reducing overhead [3]
    - Asynchronous tracing [4]

OSprofiler has already been in most of main OpenStack services such as: Nova,
Neutron, Keystone, Glance, and Cinder...

Hope that it will receive reviews from you all.

Thanks!

[1] Demo with current OSprofiler patch set in Swift:
https://tovin07.github.io/swift/swift-object-create.html
[2] A demo with OpenTracing compatible (using Uber Jaeger):
https://tovin07.github.io/opentracing/jaeger-openstack-image-list.png
[3] Tail-based coherent sampling:
https://blueprints.launchpad.net/osprofiler/+spec/tail-based-coherent-sampling
[4] Asynchronous tracing:
https://blueprints.launchpad.net/osprofiler/+spec/asynchronous-trace-collection
[5] OSprofiler documentation: https://docs.openstack.org/osprofiler/latest/

Best regards,

Vinh Nguyen Trong
PODC - Fujitsu Vietnam Ltd.


__________________________________________________________________________
OpenStack Development Mailing List (not for usage questions)
Unsubscribe: [email protected]?subject:unsubscribe
http://lists.openstack.org/cgi-bin/mailman/listinfo/openstack-dev