| Issue |
91861
|
| Summary |
PDB single-step problem inline __asm Windows WinDbg
|
| Labels |
new issue
|
| Assignees |
|
| Reporter |
prof79
|
Hi there, I'm following exercises by https://patterndiagnostics.com which use inline assembly (`__asm`) in their book. They use VC++ but I tried `clang` as this was much easier compared to all the `vcvarsall` intricacies in build scripts and gave a quick win.
Stepping through the code in `WinDbg` I encountered misbehavior and it took me like a day to figure it out doubting flags, assembler syntax and my skills as a beginner and what not. I also had a stupid bug (erroneous line) first which didn't make things easier.
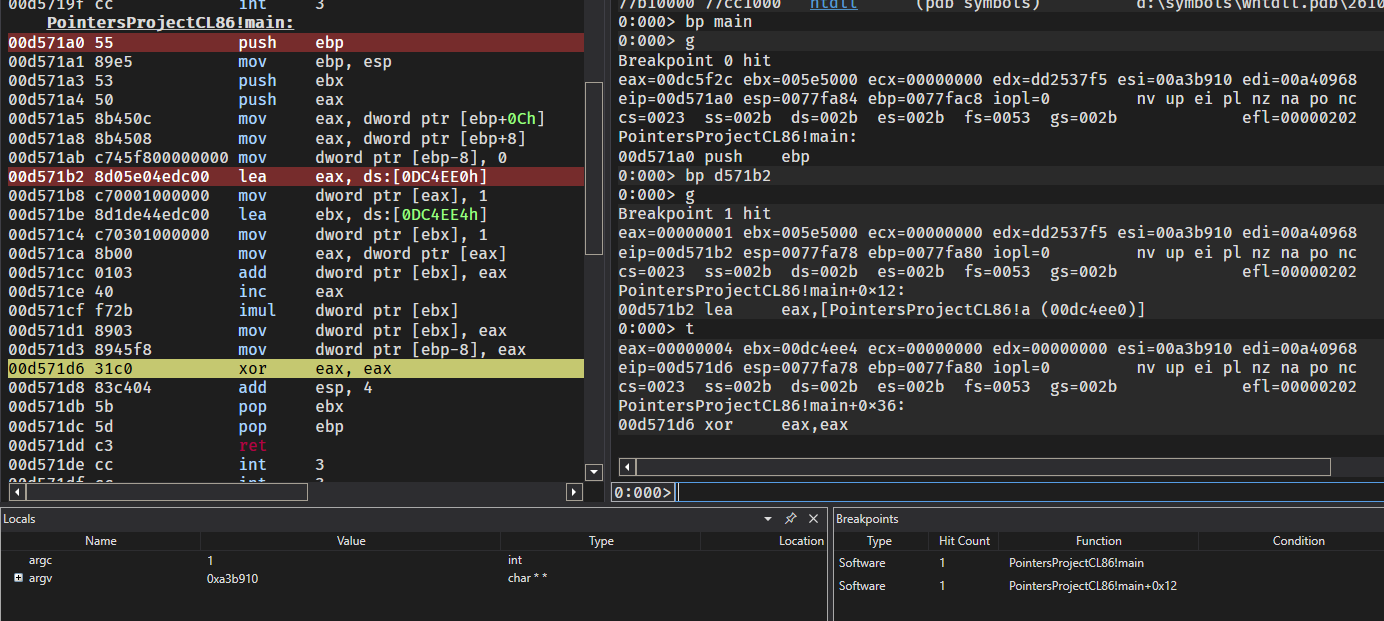
- Load the compiled EXE with symbols (PDB) in `WinDbg` (launch executable, maybe `.reload /f`).
- Break on the first `lea` instruction (`bp main+0x12`).
- Try to single-step (`t`)
Expected behavior:
- Step to next instruction (`mov dword ptr [eax], 1`)
What actually happens:
- Ending up at `xor eax, eax` (which is already in the prologue of `clang`-generated code (which is `main+0x36`)
This doesn't happen with the `cl` tooling from `Visual Studio 2022`.
I figured that the compiled EXE is actually fine, you can debug it without symbols and tracing will work as expected.
As a result, something must be wrong with the PDB generated by `clang` vs. what `cl` does as it causes wrong code steps.
I'll try to put a ZIP with the files somewhere.
Compilation line: `clang -g -gcodeview -fasm-blocks --target=i386-windows-msvc -o PointersProjectCL86.exe PointersProject.cpp`
![]()
_______________________________________________
llvm-bugs mailing list
[email protected]
https://lists.llvm.org/cgi-bin/mailman/listinfo/llvm-bugs