<https://lh4.googleusercontent.com/-HUyg_IzrJ7Y/UsMckOrUdpI/AAAAAAAAAAc/l4059E7qL5U/s1600/java_plugin.png>
Hm... I cannot run your screen cast.
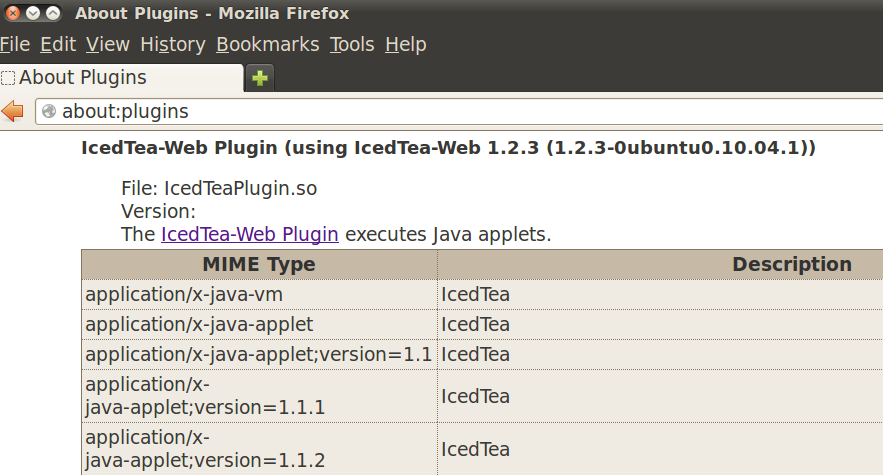
The error msg is:

Java Plugin Needed
You need the java plugin <http://java.com> to watch this screencast.


However, I have java plugin installed and configured.

*% java -version*
java version "1.6.0_27"
OpenJDK Runtime Environment (IcedTea6 1.12.6) (6b27-1.12.6-1ubuntu0.10.04.4)
OpenJDK 64-Bit Server VM (build 20.0-b12, mixed mode)

*% update-alternatives --display java*
java - auto mode
 link currently points to /usr/lib/jvm/java-6-openjdk/jre/bin/java
/usr/lib/jvm/java-6-openjdk/jre/bin/java - priority 1061
 slave java.1.gz: /usr/lib/jvm/java-6-openjdk/jre/man/man1/java.1.gz
Current `best' version is /usr/lib/jvm/java-6-openjdk/jre/bin/java.

Please also refer to the attached screen shot.

What am I missing here?

Again, thank you so much, mark.


On Tuesday, December 31, 2013 12:19:05 PM UTC-5, Mark Waite wrote:
>
> http://bit.ly/jenkins-in-five-minutes is a 5 minute screencast I created
> a few years ago.  That screencast shows how test results are typically
> presented in Jenkins.  Sorry for the boring introductory material in the
> first minute or two...
>
> There are a number of locations on the web which define the JUnit format,
> but I think you may be happier if you find a perl module which will write
> JUnit format for you, without requiring that you understand JUnit format.
>
> For example,
> http://damien.krotkine.com/2009/11/25/perl-tests-in-hudson-via-junit.html
> describes
> alternatives for Perl test reporting in a way that Jenkins can use.
>
>
> http://stackoverflow.com/questions/4095680/how-can-i-run-perl-tests-and-merge-the-results-with-junit-reports-in-ant
>  may
> also be helpful.
>
> Both of those have the benefit that you don't need to learn the JUnit
> output format.  The format is not hard to write, but why not reuse someone
> else's implementation...
>
> Mark Waite
>
>
> On Tue, Dec 31, 2013 at 9:55 AM, Charley Yen <charl...@gmail.com<javascript:>
> > wrote:
>
>> Hi Mark,
>>
>> I should be the one to apologize for not having made myself clear.
>>
>> What is the JUnit format? Could you show me an example?
>>
>> Yes, I can write my tool to produce any formats to feed jenkins. My
>> problem is I don't know WHAT format my tool should produce. I need a sample
>> data file to show me the format, either CSV or XML.
>>
>> BTW, I don't know much about Java and/or JUnit. I just want to have
>> jenkins plot a pie chart after EACH run of my tool which is implemented in
>> perl.
>>
>> Please show me a sample data file. for instance, would the following
>> formats work?
>>
>> CSV:
>> pass,fail,skip
>> 90%,2%,8%
>>
>> XML:
>> <pass>90%</pass>
>> <fail>2%</fail>
>> <skip>8%</skip>
>>
>> If they work, what configurations do I need to do in "Post-build
>> Actions"? Please show me the screen shots.
>>
>> For the links ou gave me, I wish I could see the configure page.
>>
>> Again, thank you so much, mark, for your time, effort, and help!
>>
>> On Tuesday, December 31, 2013 11:28:56 AM UTC-5, Mark Waite wrote:
>>
>>> I'm sorry, but I still don't understand what you're hoping to gain from
>>> a pie based representation of the data.  What is in a pie based
>>> representation that is not already available in the Jenkins test results
>>> history graph on the right hand side?  That existing graph shows percent
>>> passed, percent failed, and also shows the history of those values across
>>> builds.  It also already includes a number of nice navigation features
>>> (show failures only, show failures and successes, click to open a specific
>>> job, etc.)
>>>
>>> Since you control the format which you are writing from your test tool,
>>> you could as easily write JUnit format as any other format.  If you write
>>> JUnit format, then Jenkins will show the history of the test pass / fail
>>> percentages and will allow you to select any one of the tests to see more
>>> information about that test run, including which specific tests failed.
>>>  You would have the percentage pass / fail information you want for the
>>> most recent test run, plus a historical view of past test runs.  You also
>>> gain the benefit that other tools and plugins which can read JUnit format
>>> test results may be able to help you even further.
>>>
>>> That section of the Jenkins Cookbook is describing the plot plugin.  If
>>> you're still determined that you must have a pie chart, then you could
>>> refer to the source code of the Plot plugin to reverse engineer the data
>>> formats it will consume.  https://github.com/jenkinsci/plot-plugin is
>>> the source code, I believe.
>>>
>>> Mark Waite
>>>
>>>
>>> On Tue, Dec 31, 2013 at 8:25 AM, Charley Yen <charl...@gmail.com> wrote:
>>>
>>>> Thank you, Mark.
>>>>
>>>> I visited the link you gave me. But I don't see any charts/plots there.
>>>> Maybe I misunderstood you?
>>>>
>>>> My tests are not JUnit tests.
>>>>
>>>> Here is what we do at work:
>>>>
>>>> I developed a cmdline test tool in perl. This tool tests whether our
>>>> nightly builds (in perforce, mainly c codes at kernel level) can be
>>>> installed on 100+ Linux hosts. So it is merely a smoke test.
>>>>
>>>> My tool can compile a report in html format which lists pass/fail/skip
>>>> on every host with links to the detailed log files.
>>>>
>>>> I have configured my test tool run through Jenkins. What I am trying to
>>>> do now is as follows:
>>>>
>>>> Besides publish the html report, it would be nice to draw a pie chart
>>>> to show the results visually, such as 90% pass (in green), 2% fail (in
>>>> red)
>>>> and 8% skipped (in yellow).
>>>>
>>>> But I don't know --
>>>> 1) How to format the data for Jenkins to use? CSV of XML? Please show
>>>> me smaple files.
>>>> 2) What plugin to use? I guess it might be either plot plugin or
>>>> dashboard view plugin?
>>>> 3) How to configure my jenkins to read the data file? Please show me
>>>> what-to-do/how-to-do step by step with screen shots. All I know is that
>>>> this has to be done in "Post-build Actions" stage.
>>>>
>>>> In addition, I have read this book: "Jenkins Continous Integration
>>>> Cookbook" by Alan Mark Berg:
>>>> http://s1.downloadmienphi.net/file/downloadfile7/171/1380449.pdf
>>>> The book has an example and I could make it work on my jenkins.
>>>>
>>>> However, the book also says (pp. 91):
>>>>
>>>> "There are currently two other data formats that you can use: XML and
>>>> CSV. However, until the online help clearly explains the structures used,
>>>> I
>>>> would recommend staying with the properties format."
>>>>
>>>> That's exactly what I need, I guess. :(
>>>>
>>>> Again, thank you, Mark. Your help is highly appreciated. Have a
>>>> wonderful 2014.
>>>>
>>>> Charley
>>>>
>>>>
>>>>
>>>>
>>>> On Monday, December 30, 2013 2:58:09 PM UTC-5, Mark Waite wrote:
>>>>
>>>>> Jenkins has built-in support to read the results of JUnit tests from
>>>>> JUnit XML result files, and displays those results.  Many tools are able
>>>>> to
>>>>> write JUnit XML test result files (Java unit test libraries, C++ unit
>>>>> test
>>>>> libraries, Ruby unit test libraries, Python unit test libraries, etc.)
>>>>> If
>>>>> you can write your results in an XML format that is compatible with JUnit
>>>>> XML, then Jenkins will display the results without any plugins.
>>>>>
>>>>> I don't know what you're hoping to gain from a pie chart presentation
>>>>> of the test results.  If you truly require a pie chart, you may need to
>>>>> investigate one of the charting plugins.  I'd suggest first that you look
>>>>> at the existing Jenkins test results displays.  They probably already
>>>>> meet
>>>>> your needs.
>>>>>
>>>>> An example of the Jenkins unit test results is visible at:
>>>>>
>>>>> https://buildhive.cloudbees.com/job/MarkEWaite/job/git-plugi
>>>>> n/59/testReport/
>>>>>
>>>>> Thanks,
>>>>> Mark Waite
>>>>>
>>>>>
>>>>> On Fri, Dec 27, 2013 at 8:39 AM, Charley Yen <charl...@gmail.com>wrote:
>>>>>
>>>>>>
>>>>>>
>>>>>> <http://stackoverflow.com/questions/20787761/need-help-guidance-on-jenkins-plot-plugin-setup-and-configure#>
>>>>>>
>>>>>>
>>>>>> I am new to Jenkins and need some help to configure it so that it can
>>>>>> display my test results in pie chart.
>>>>>>
>>>>>> It's my first time being here and still getting to know this group so
>>>>>> if someone has already asked the same or similar question before, my
>>>>>> apology. I actually did a search. But still, I could have missed the
>>>>>> previous posts.
>>>>>>
>>>>>> I have a tool to run a smoke test which is to install a piece of
>>>>>> software on multiple hosts. And my tool can keep track the number of
>>>>>> passed/failed/skipped installations. I want to display the test
>>>>>> statistics
>>>>>> in a pie chart on jenkins. What plug-ins am I supposed to use? What kind
>>>>>> of
>>>>>> data file am I supposed to provide? Please show me step by step with
>>>>>> data
>>>>>> file format and the screen shots.I guess I should generate either csv or
>>>>>> xml files. But I don't know what the exact formats in either file. And I
>>>>>> don't know how to configure my jenkins to read this file. I don't even
>>>>>> know
>>>>>> what plugin I should use, plot plugin or dashboard plugin or something
>>>>>> else?
>>>>>>
>>>>>> I hope I have made myself clear and your help is highly appreciated.
>>>>>>
>>>>>> --
>>>>>> You received this message because you are subscribed to the Google
>>>>>> Groups "Jenkins Users" group.
>>>>>> To unsubscribe from this group and stop receiving emails from it,
>>>>>> send an email to jenkinsci-use...@googlegroups.com.
>>>>>>
>>>>>> For more options, visit https://groups.google.com/groups/opt_out.
>>>>>>
>>>>>
>>>>>  --
>>>> You received this message because you are subscribed to the Google
>>>> Groups "Jenkins Users" group.
>>>> To unsubscribe from this group and stop receiving emails from it, send
>>>> an email to jenkinsci-use...@googlegroups.com.
>>>> For more options, visit https://groups.google.com/groups/opt_out.
>>>>
>>>
>>>  --
>> You received this message because you are subscribed to the Google Groups
>> "Jenkins Users" group.
>> To unsubscribe from this group and stop receiving emails from it, send an
>> email to jenkinsci-use...@googlegroups.com <javascript:>.
>> For more options, visit https://groups.google.com/groups/opt_out.
>>
>
>

--
You received this message because you are subscribed to the Google Groups
"Jenkins Users" group.
To unsubscribe from this group and stop receiving emails from it, send an email
to jenkinsci-users+unsubscr...@googlegroups.com.
For more options, visit https://groups.google.com/groups/opt_out.