On Mon, May 23, 2016 at 5:19 PM, Gary E. Miller <g...@rellim.com> wrote:
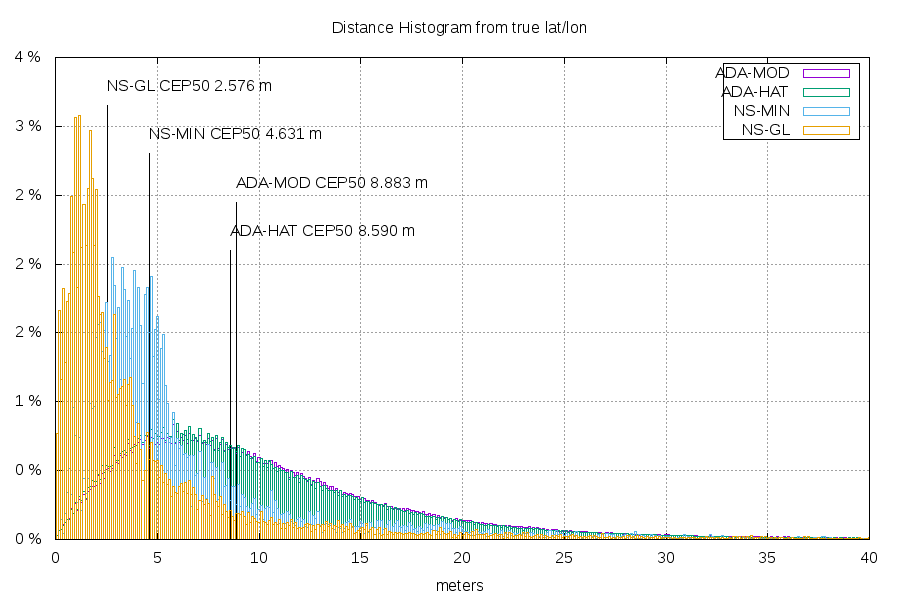
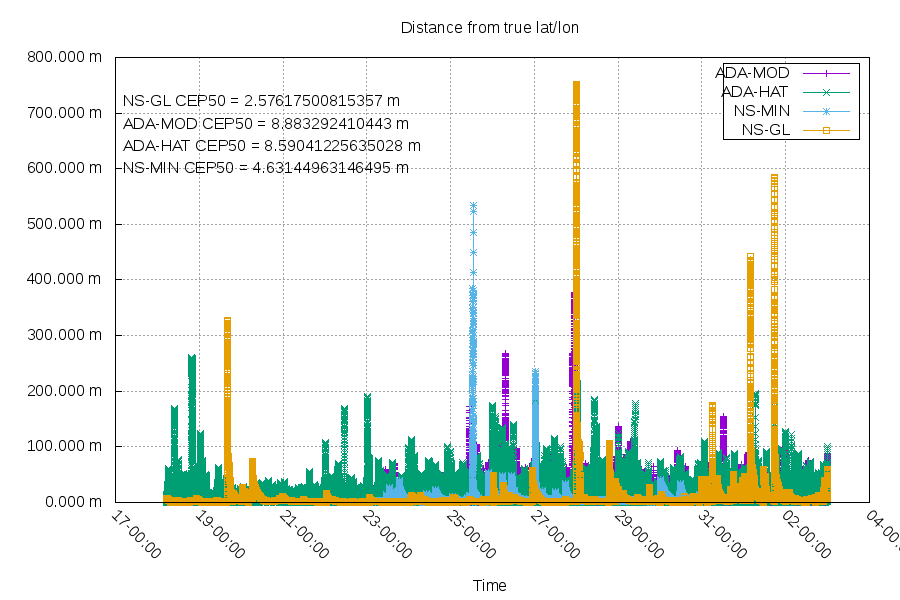
> Yo Dan!
>
> On Mon, 23 May 2016 16:06:19 -0500
> Dan Drown <dan-...@drown.org> wrote:
>
> > I'd be interested in installing these bits:
> >
> > https://github.com/ddrown/chrony-graph - graphs (I have a ntpd port
> > of this already, not yet published)
> >   - example output: https://dan.drown.org/rpi/latest/
> >
> > https://github.com/ddrown/ntp-www - realtime status (also have an
> > unpublished ntpd port)
> >   - an example of this on a machine without a gps module is here:
> > https://clock.drown.org/
> >
> > I've also been working on CEP50 measurements of various GPS
> > modules. That might be useful as well.
> >   - example graphs from that: https://dan.drown.org/gps/distance.png
> > + https://dan.drown.org/gps/cep50.png
>
> Wow, good stuff.  I'd love to see the ntpd port.
>
> At some point I hope someone comes up with some realtime plots instead
> of relying on gnuplot.  For example, real time scatter plots instead
> of having to wait like gpsprod does.
>
> RGDS
> GARY
>

Agreed, that looks really nice.

One thing I'm trying to develop is a method to track multiple system
simultaneously.  I'm thinking of a monitor system with its own time base
using NTP to query state from each of the test systems.

I may write the first version in Python wrapping ntpdig.

Clark
_______________________________________________
devel mailing list
devel@ntpsec.org
http://lists.ntpsec.org/mailman/listinfo/devel