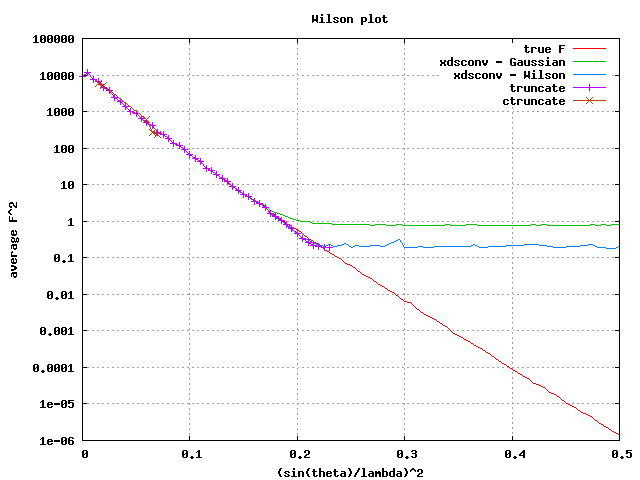
Actually, Jeff, the problem goes even deeper than that. Have a look at these
Wilson plots:
http://bl831.als.lbl.gov/~jamesh/wilson/wilsons.png
For these plots I took Fs from a unit cell full of a random collection of
atoms, squared them, added Gaussian noise with RMS = 1, and then ran them back
through various programs. The "plateau" at F ~ 1 which overestimates some "true
intensities" by almost a factor of a million arises because French & Wilson did
not think it "right" to use the slope of the Wilson plot as a source of prior
information. A bit naive, I suppose, because we can actually be REALLY sure
that 1.0 A intensities are "zero" if the data drop into the noise at 3A.
Nevertheless, no one has ever augmented the F&W procedure to take this prior
knowledge into account.

A shame! Because if they did there would be no need for a resolution cut-off at
all.

Sent from a tiny virtual keyboard on a plane about to take off

On Jun 19, 2013, at 1:08 AM, Jeff Headd <[email protected]> wrote:

> Hi Ed,
>
> Thanks for including the code block.
>
> I've looked back over the F&W paper, and the reason for the h<-4.0 cutoff is
> that the entire premise assumes that the true intensities are normally
> distributed, and the formulation breaks down at that far out of an "outlier".
> For most datasets I haven't seen this assumption to be a huge problem, but in
> some cases the assumption of a normal distribution is not reasonable, and
> you'll end up with a higher percentage of rejected weak intensities.
>
> Kay, does the new XDSCONV method treat the negative intensities in some way
> to make them positive, or does this just work with very weak positive
> intensities?
>
> Jeff
>
>
> On Tue, Jun 18, 2013 at 12:15 AM, Ed Pozharski <[email protected]> wrote:
> Jeff,
>
> thanks - I can see the same equation and cutoff applied in ctruncate source.
>   Here is the relevant part of the code
>
>>         // Bayesian statistics tells us to modify I/sigma by subtracting off
>> sigma/S
>>         // where S is the mean intensity in the resolution shell
>>         h = I/sigma - sigma/S;
>>         // reject as unphysical reflections for which I < -3.7 sigma, or h <
>> -4.0
>>         if (I/sigma < -3.7 || h < -4.0 ) {
>>             nrej++;
>>             if (debug) printf("unphys: %f %f %f %f\n",I,sigma,S,h);
>>             return(0);
>>         }
>
> This seems to be arbitrary cutoff choice, given that they are hard-coded.  At
> the very least, cutoffs should depend on the total number of reflections to
> represent famyliwise error rates.
>
> It is however the h-based rejection that seems most problematic to me.  In
> the dataset in question, up to 20% reflections are rejected in the highest
> resolution shell (granted, I/sigI there is 0.33).  I would expect that
> reflections are rejected when they are deemed to be outliers due to reasons
> other than statistical errors (e.g. streaks, secondary lattice spots in the
> background, etc).  I must say that this was done with extremely good quality
> data, so I       doubt that 1 out of 5 reflections returns some physically
> impossible measurement.
>
> What is happening is that <sigma>=3S in the highest resolution shell, and for
> many reflection h<-4.0.  This does not mean that reflections are "unphysical"
> though, just that shell as a whole has mostly weak data (in this case 89%
> with I/sigI<2 and 73% with I/sigI<1).
>
> What is counterintuitive is why do I have to discard reflections that are
> just plain weak, and not really outliers?
>
> Cheers,
>
> Ed.
>
>
>
>
> On 06/17/2013 10:29 PM, Jeff Headd wrote:
>> Hi Ed,
>>
>> I'm not directly familiar with the ctruncate implementation of French and
>> Wilson, but from the implementation that I put into Phenix (based on the
>> original F&W paper) I can tell you that any reflection where (I/sigI) -
>> (sigI/mean_intensity) is less than a defined cutoff (in our case -4.0), then
>> it is rejected. Depending on sigI and the mean intensity for a given shell,
>> this can result in positive intensities that are also rejected. Typically
>> this will effect very small positive intensities as you've observed.
>>
>> I don't recall the mathematical justification for this and don't have a copy
>> of F&W here at home, but I can have a look in the morning when I get into
>> the lab and let you know.
>>
>> Jeff
>>
>>
>> On Mon, Jun 17, 2013 at 5:04 PM, Ed Pozharski <[email protected]> wrote:
>> I noticed something strange when processing a dataset with imosflm.  The
>> final output ctruncate_etc.mtz, contains IMEAN and F columns, which
>> should be the conversion according to French&Wilson.  Problem is that
>> IMEAN has no missing values (100% complete) while F has about 1500
>> missing (~97% complete)!
>>
>> About half of the reflections that go missing are negative, but half are
>> positive.  About 5x more negative intensities are successfully
>> converted.  Most impacted are high resolution shells with weak signal,
>> so I am sure impact on "normal" refinement would be minimal.
>>
>> However, I am just puzzled why would ctruncate reject positive
>> intensities (or negative for that matter - I don't see any cutoff
>> described in the manual and the lowest I/sigI for successfully converted
>> reflection is -18).
>>
>> Is this a bug or feature?
>>
>> Cheers,
>>
>> Ed.
>>
>> --
>> I don't know why the sacrifice thing didn't work.
>> Science behind it seemed so solid.
>>                                     Julian, King of Lemurs
>>
>
>
> --
> Oh, suddenly throwing a giraffe into a volcano to make water is crazy?
>                                                 Julian, King of Lemurs
>