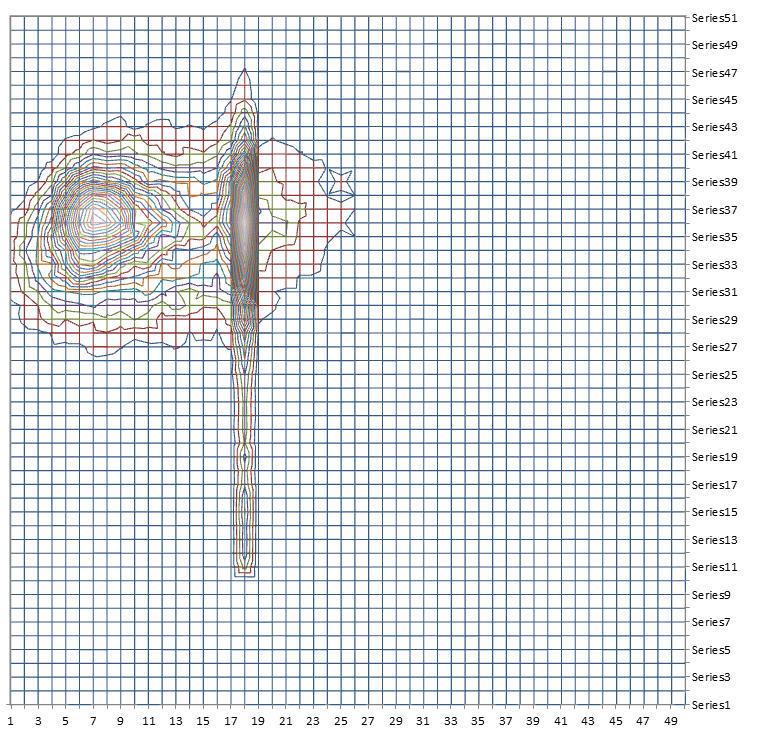
Dear All,

when I plot bulk solvent B and K extracted from EDS, an improbable and
bimodal distribution appears.
In the B_sol vs k_sol PDF a sharp line of values with B-sol of 70 appears
(B-axis left to right, 0-200).
http://www.ruppweb.org/images/b_sol_contour.jpg
http://www.ruppweb.org/images/b_sol_surface.jpg

According to a quick peak at EDS instructions,
it uses the REFMAC flat bulk solvent model throughout  for bulk solvent
correction.

The main peak in fact has the expected distribution, but it seems that the
sharp peak at B_sol=70
represents some cut-off that in a certain set of calculations was used.

For data mining it would be useful to know where/when these cutoffs were
used.

Best regards, BR
-----------------------------------------------------------------
Bernhard Rupp
http://www.ruppweb.org/
-----------------------------------------------------------------